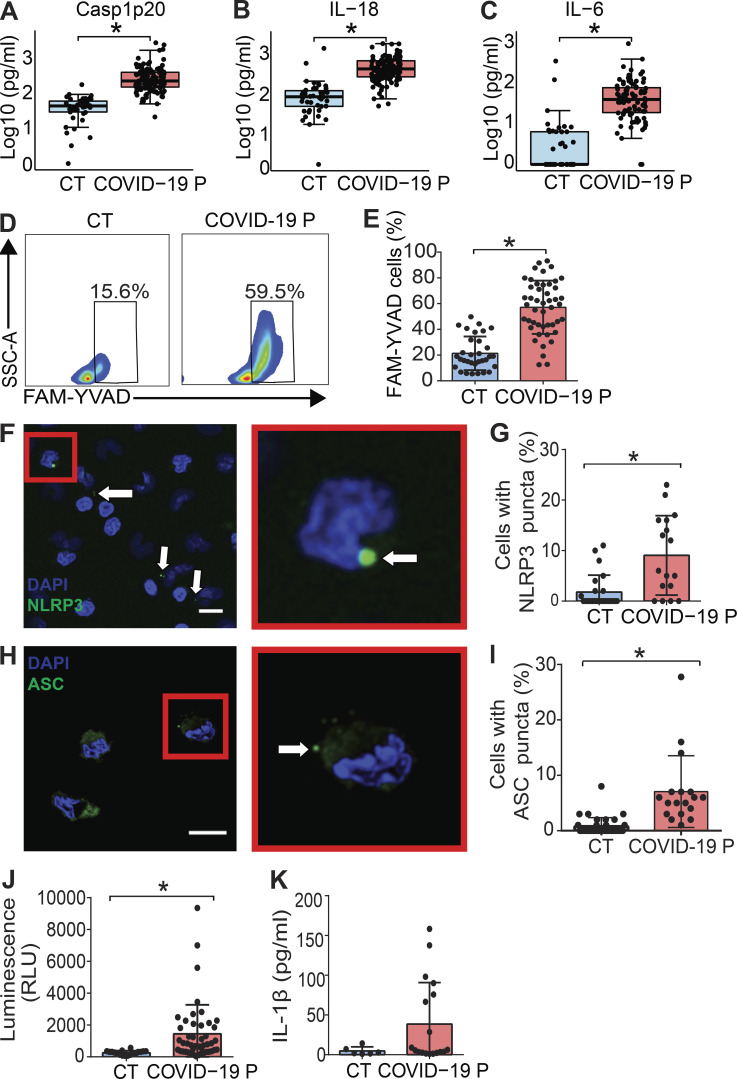
Figure 2.
Inflammasome activation in COVID-19 patients. (A–C) Cytokine concentration in the serum control individuals (CT, n = 42 to ELISA and 45 to CBA) and COVID-19 patients (COVID-19 P, n = 124 to ELISA and 92 to CBA; all tested positive using RT-PCR). Active caspase-1 (Casp1p20; A) and IL-18 (B) were measured by ELISA, and IL-6 (C) was measured by CBA. Data shown as Log10-transformed concentrations in picograms per milliliter. (D–I) PBMCs were isolated from fresh blood of CT or COVID-19 P. (D and E) FAM-YVAD+ PBMCs were estimated by FACS using the FLICA Caspase-1 Assay Kit. (D) Representative histograms of one representative CT and one COVID-19 P indicate the gate for determination of the percentage of FAM-YVAD+ cells. (E) The percentage of FAM-YVAD+ cells for the 32 CT and 47 COVID-19 P. (F) PBMCs from COVID-19 P were stained with anti-NLRP3 (green) for determination of NLRP3 puncta (white arrows) and DAPI to stain the cell nuclei (blue). Inset (red) shows a higher magnification of a cell containing NLRP3 puncta. Scale bar, 10 µm. (G) The percentages of cells with NLRP3 puncta are shown for 24 CT and 17 COVID-19 P. (H) PBMCs from COVID-19 P were stained with anti-ASC (green) for determination of ASC puncta (white arrow). DAPI stains the cell nuclei (blue). Inset (red) shows a higher magnification of a cell containing ASC puncta. Scale bar, 10 µm. (I) The percentages of cells with ASC puncta are shown for 35 CT and 18 COVID-19 P. (J) PBMCs from 18 CT and 46 COVID-19 P were maintained in culture for 16 h, and the supernatants were assayed for caspase-1 activity using the Caspase-Glo 1 Assay. (K) PBMCs from 6 CT or 18 COVID-19 P were maintained in culture for 16 h and IL-1β production were estimated by ELISA. *, P < 0.05 as determined by Student’s t test (A, P = 0.00000025; B, P = 0.0000063; C, P = 0.00000025) or Mann–Whitney test (E, P = 0.00018; G, P = 0.00076; I, P = 0.0011; J, P = 0.0076; K, P = 0.1293). Each dot represents the value from a single individual. Box corresponds to average ± SD of the values. Data shown in E, G, and I–K result from multiple experiments that have been pooled to generate the figures. SSC-A, side scatter–A; RLU, relative light unit.

