Figure 4.
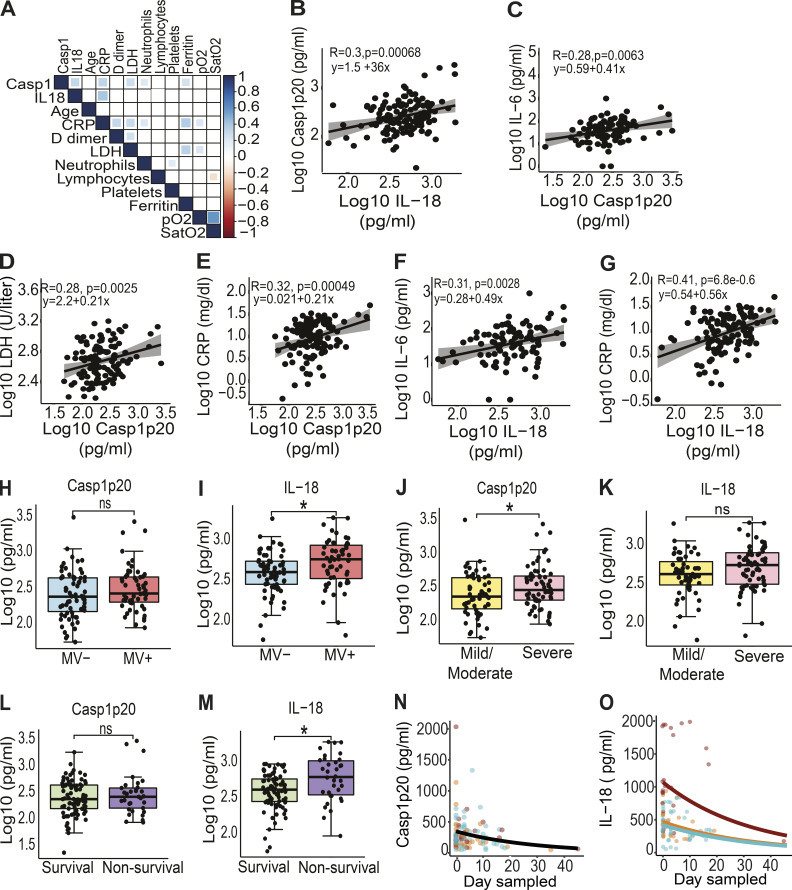
Inflammasome activation influences the clinical outcome of COVID-19. (A) Correlation matrix of Casp1p20 and IL-18 levels in the serum of COVID-19 patients on the hospitalization day with patient characteristics and clinical parameters. (B–J) Correlations of Casp1p20 with IL-18 (B), Casp1p20 with IL-6 (C), Casp1p20 with LDH (D), Casp1p20 with CRP (E), IL-18 with IL-6 (F), and IL-18 with CRP (G). (H and I) Levels of Casp1p20 (H) and IL-18 (I) in patients who required MV (MV+, blue box) or not (MV−, red box). (J and K) Levels of Casp1p20 (J) and IL-18 (K) in patients with mild/moderate (yellow box) or severe COVID-19 (pink box). (L and M) Levels of Casp1p20 (L) and IL-18 (M) in survivors (green box) or nonsurvivors (purple box). The levels of Casp1p20 and IL-18 were measured by ELISA and are shown as Log10-transformed concentrations in picograms per milliliter. *, P < 0.05 as determined by Student’s t test (H, P = 0.160; I, P = 0.014; J, P = 0.036; K, P = 0.068; L, P = 0.430; M, P = 0.0044). Each dot represents value from a single individual. Box corresponds to average ± SD of the values. (N and O) Derived predictions from the best-fit models retained in Casp1p20 (N) and IL-18 (O) longitudinal analyses; IL-18 model (O) comprises variation in the intercept among patient groups: death (red), critical/recovery (orange), and mild/recovery (blue). ns, not significant.

