Figure S2.
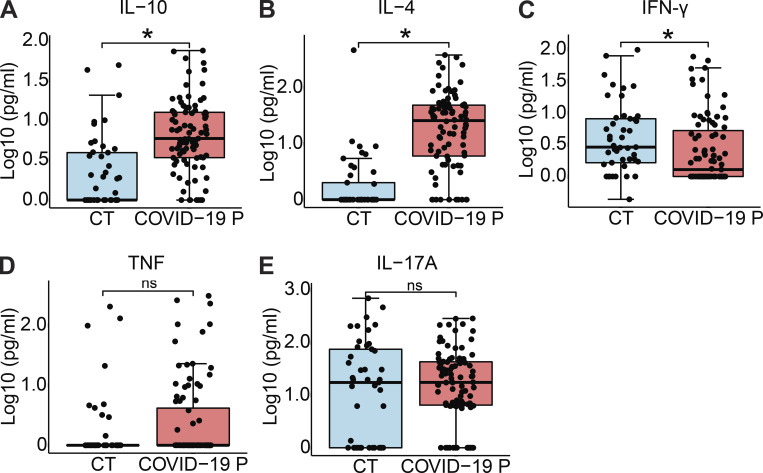
Cytokine production in COVID-19 patients. Cytokine concentration in the serum controls individuals (CT, n = 45) and COVID-19 patients (COVID-19 P, n = 92; all tested positive using RT-PCR). (A–E) IL-10 (A), IL-4 (B), IFN-γ (C), TNF-α (D), and IL-17A (E) were measured by CBA. Data are shown as Log10-transformed concentrations in picograms per milliliter. *, P < 0.05 as determined by Student’s t test (A, P = 0.001550; B, P = 0.000000394; C, P = 0.029000; D, P = 0.3; E, P = 0.49). Each dot represents the value from a single individual. Box shows average ± SD of the values. ns, not significant.

