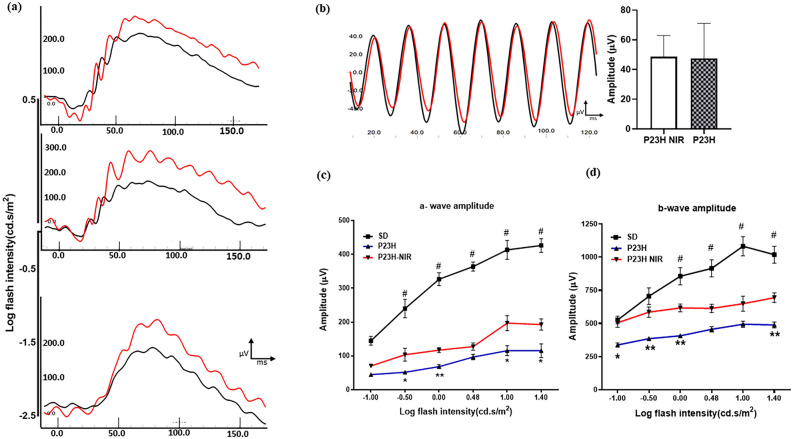
Figure 3.
Photobiomodulation protects retinal function, assessed by ERG analysis. (a) Shows representative ERG waveforms measured in dark-adapted sham-treated (black) and 830 nm PBM-treated (red) P23H rats by ISCEV protocol34 at the lowest (10mcd.s/m2) and the highest flash intensities (3000 and 10,000 mcd.s/m2). 830 nm PBM treatment improved the b-wave response at low stimulus intensities and the a and b wave responses at higher stimulus intensities. (b) Illustrates standard flicker response in the ISCEV protocol (3 cd.s/m2 @ 30 Hz) representing cone function in sham-treated and PBM-treated rats. Representative flicker responses are shown in P23H (black) and PBM-treated P23H (red) rats. There was no statistical significance observed in the flicker response between the sham-treated and 830 nm PBM-treated rats. (c) and (d) show the mean a-wave and mean b-wave ERG amplitudes (respectively) measured by scotopic intensity series protocol comparing P23H transgenic retina (filled square) and 830 nm treated P23H retina (filled triangle). 830 nm PBM treatment produced a significant increase in both a-wave (F(1,14) = 16.32, p < .001; n = 8) and b-wave amplitudes (F(1,22) = 23.57, p < .001; n = 12) at all flash intensities compared to the P23H group. Error bars: SE.

