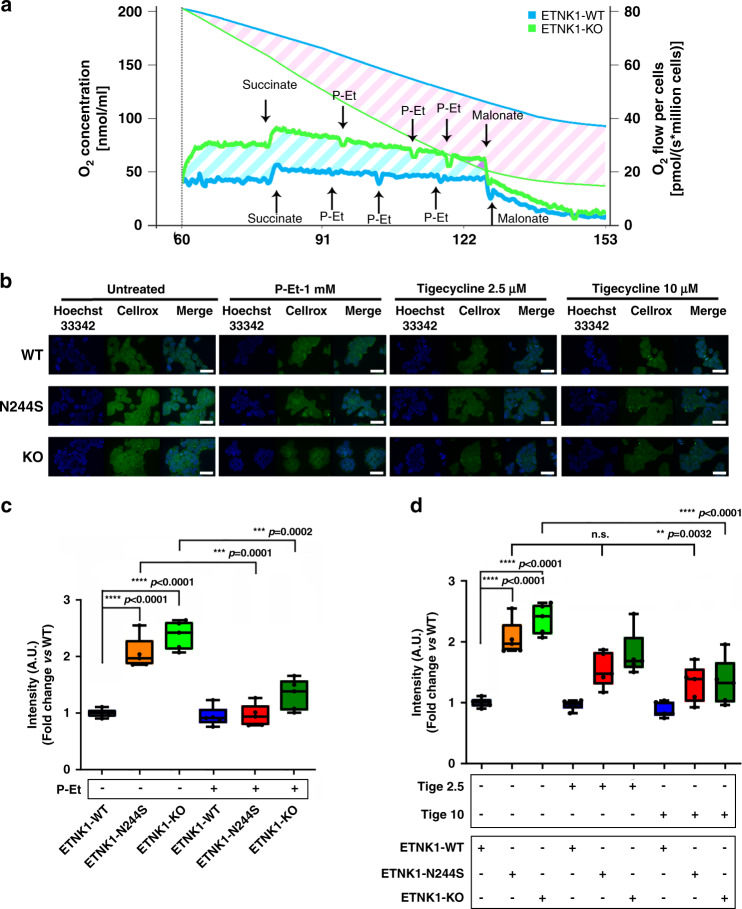
Fig. 3. Mitochondria respiration and ROS production.
a Representative graph of O2 consumption rate (pmol/(s*106 cells)) and O2 concentration (nmol/ml) in ETNK1-WT and KO CRISPR lines (n = 4), measured by high-resolution respirometry Oroboros O2K (1 million cells). The thick blue and green lines represent the oxygen consumption rate of ETNK1-WT and KO cells, respectively; the thin blue and green lines show the oxygen concentration in ETNK1-WT and KO oxygraph chambers, respectively. The diagonal cyan and pink stripes highlight, respectively, the difference in oxygen consumption rate and oxygen concentration of ETNK1-WT and KO cells. b Intracellular reactive oxygen species as assessed by confocal microscopy using the CellROX reagent. ROS analysis was performed in ETNK1-WT, N244S, and KO CRISPR lines in the absence and presence of P-Et 1 mM, tigecycline 2.5 µM and tigecycline 10 µM. Both the P-Et and the tigecycline treatments lasted 24 h. At least 200 cells were analyzed. The scale bar corresponds to 40 µm. c ROS quantification in ETNK1-WT, N244S, and KO CRISPR lines in the absence and presence of 1 mM P-Et. The boxplots delimit the interquartile range; the central bar represents the median; the whiskers extend from minimum to maximum (n = 5 representative fields). Statistical analyses were performed using one-way ANOVA with Tukey’s post-hoc test. d ROS quantification in ETNK1-WT, N244S, and KO CRISPR lines in the absence and presence of 2.5 and 10 µM tigecycline. The boxplots delimit the interquartile range; the central bar represents the median; the whiskers extend from minimum to maximum (n = 5 representative fields). Statistical analyses were performed using one-way ANOVA with Tukey’s post-hoc test. Source data are provided as a Source data file.

