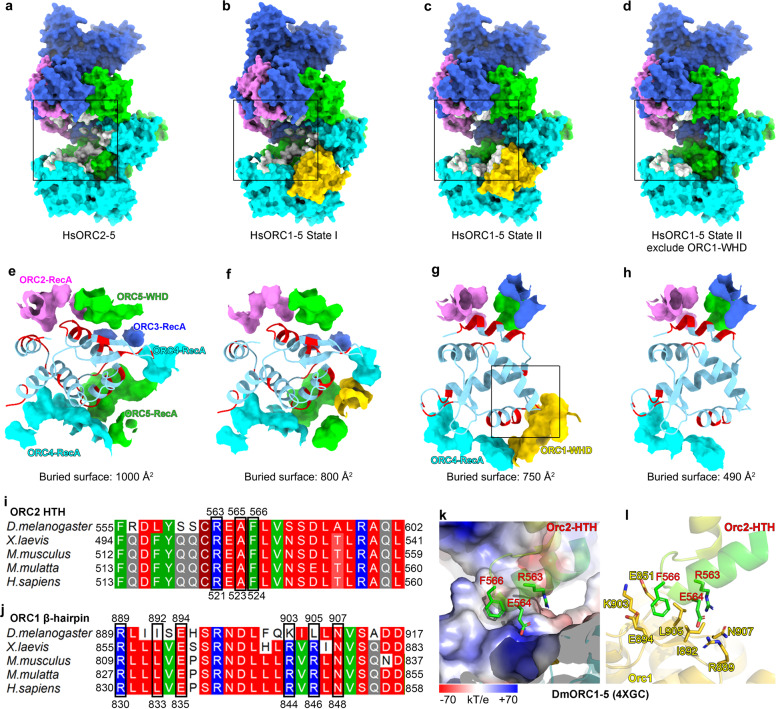
Fig. 3. Alteration in the interface between ORC2-WHD and the DNA-binding channel in State I–II transition of human ORC1–5.
a–d Surface representation of the atomic models showing the buried surface of the interface between ORC2-WHD and the DNA-binding channel in ORC2–5 (a), ORC1–5 State I (b), ORC1–5 State II (c) and ORC1–5 State II excluding ORC1–WHD (d). ORC subunits are color-coded and labeled, with the buried residues from the channel components highlighted in gray. For clarity, ORC2-WHDs are omitted. e–h Zoomed-in view of the boxed regions in a–d showing the detailed interfaces. The buried residues of each domain constituting the DNA-binding channel are extracted and shown as surface. ORC2-WHD is shown in cartoon representation, with corresponding buried residues highlighted in red. i Sequence alignment of ORC2-HTH from different species. The key residues contributing to the interaction with β-hairpin of ORC1-WHD are highlighted and numbered. j Sequence alignment of ORC1-β-hairpin from different species. The key residues contributing to the interaction with ORC2-HTH are highlighted and numbered. k, l Atomic interactions between the turn loop of Orc2-HTH and the Orc1-β-hairpin of DmORC (PDB: 4XGC) in the same region boxed in g. The electrostatic potential surface of DmOrc1-β-hairpin contacting DmOrc2-HTH is displayed in k. The key residues involved in interactions are labeled.

