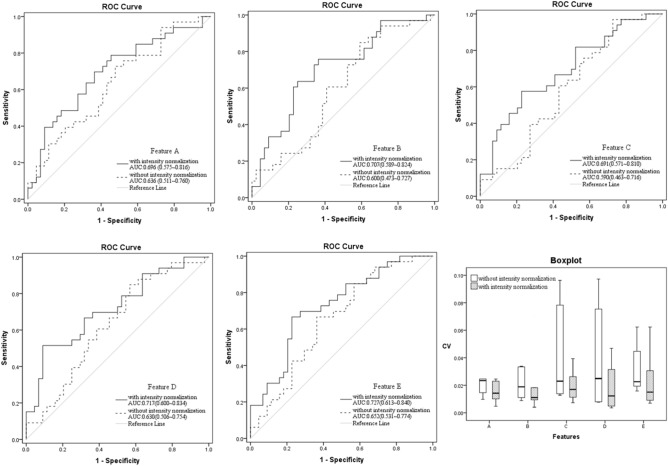
Figure 2.
ROC curves and the boxplot. Note From ROC curves, all the area under the ROC curve values of these representative radiomics features in discriminating cervical junctional zone from outer muscular layer in leiomyoma patients were higher with intensity normalization than those without intensity normalization. And the boxplot showed that all the CV values were lower with intensity normalization than those without intensity normalization among these common representative radiomics features. Feature A: GLCMEntropy_angle90_offset4; Feature B: GLCMEntropy_AllDirection_offset7; Feature C: GLCMEntropy_angle135_offset1; Feature D: RunLengthNonuniformity_angle90_offset1; Feature E: histogram Energy/Entropy.

