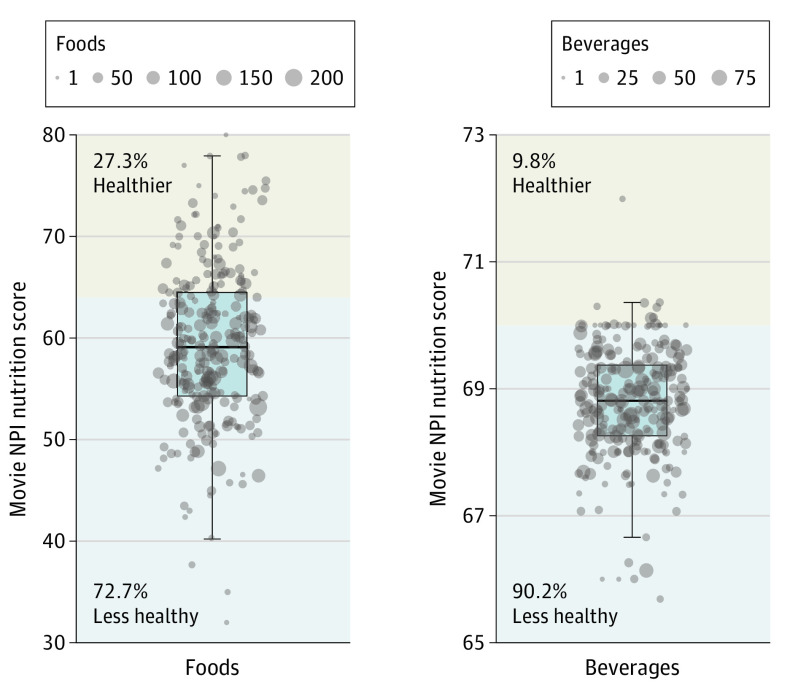
Figure 1. Movie-Level Nutrient Profile Index (NPI) Nutrition Ratings.
Movie-level NPI nutrition ratings for foods (245 movies with food scenes) and beverages (246 movies with beverage scenes). The upper regions represent nutrition scores classified as healthier, and the lower regions represent nutrition scores classified as less healthy by the NPI, which would fail legal advertising limits to youths in the United Kingdom.4 Each boxplot inner horizontal line represents the median, boxes represent the interquartile range (25th and 75th percentiles), and vertical lines represent 1.5 times the interquartile range. Dot size corresponds to the number of foods or beverages per movie.

