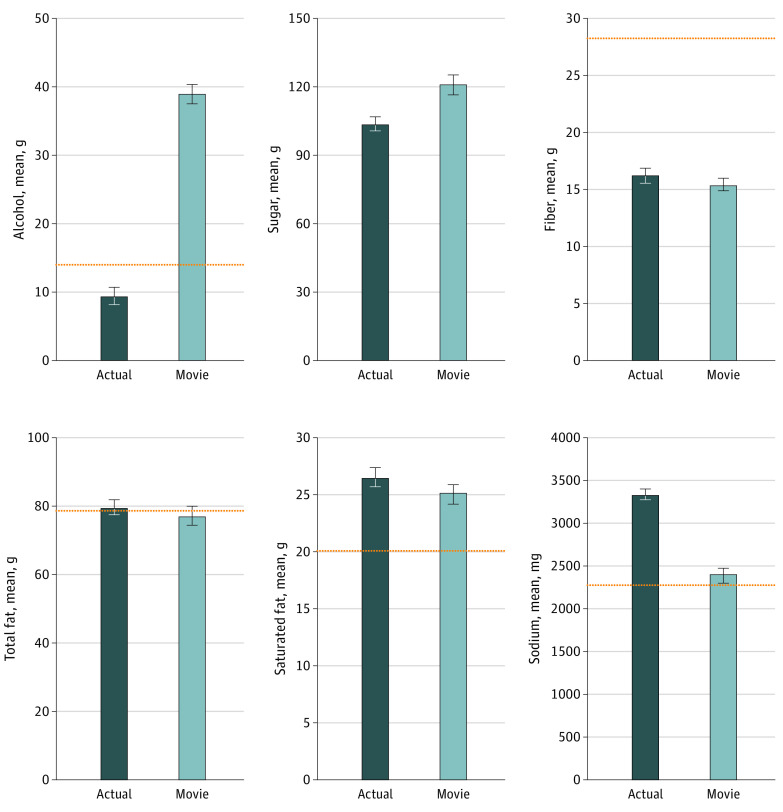
Figure 3. Movie-Depicted Nutritional Content and US Individuals’ Actual Intake.
Actual represents mean quantities consumed per 2000 kcal of total food and beverage intake for US individuals (all ages) based on National Health and Nutrition Examination Survey 2015-2016 data.34 Movie represents model-estimated nutrient quantities per 2000 kcal across all depicted food and beverages. Error bars represent 95% CI of the estimate. The dashed line for alcohol represents 1 alcoholic beverage equivalent. The dashed lines for fiber, total fat, saturated fat, and sodium represent US Food and Drug Administration–recommended daily values.33 There is no daily recommended limit for total sugars.

