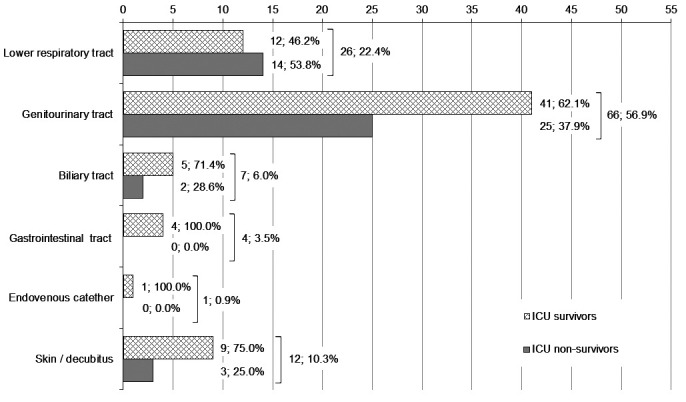
Figure 2.

Primary sources of infection. Every source of infection is presented with two bars (pattern fill for intensive care unit [ICU] survivors, gray fill for ICU non-survivors). The absolute number and the percentage of ICU survivors/non-survivors within the total number of patients with a certain source of infection are presented alongside each bar. Square brackets are followed by the total number of patients with a certain source of infection and the percentage of these patients within the total number of patients in the study.
