
Figure 2. Transgenic TCRs outcompete the iTCR for expression on the cell surface in NKTs.
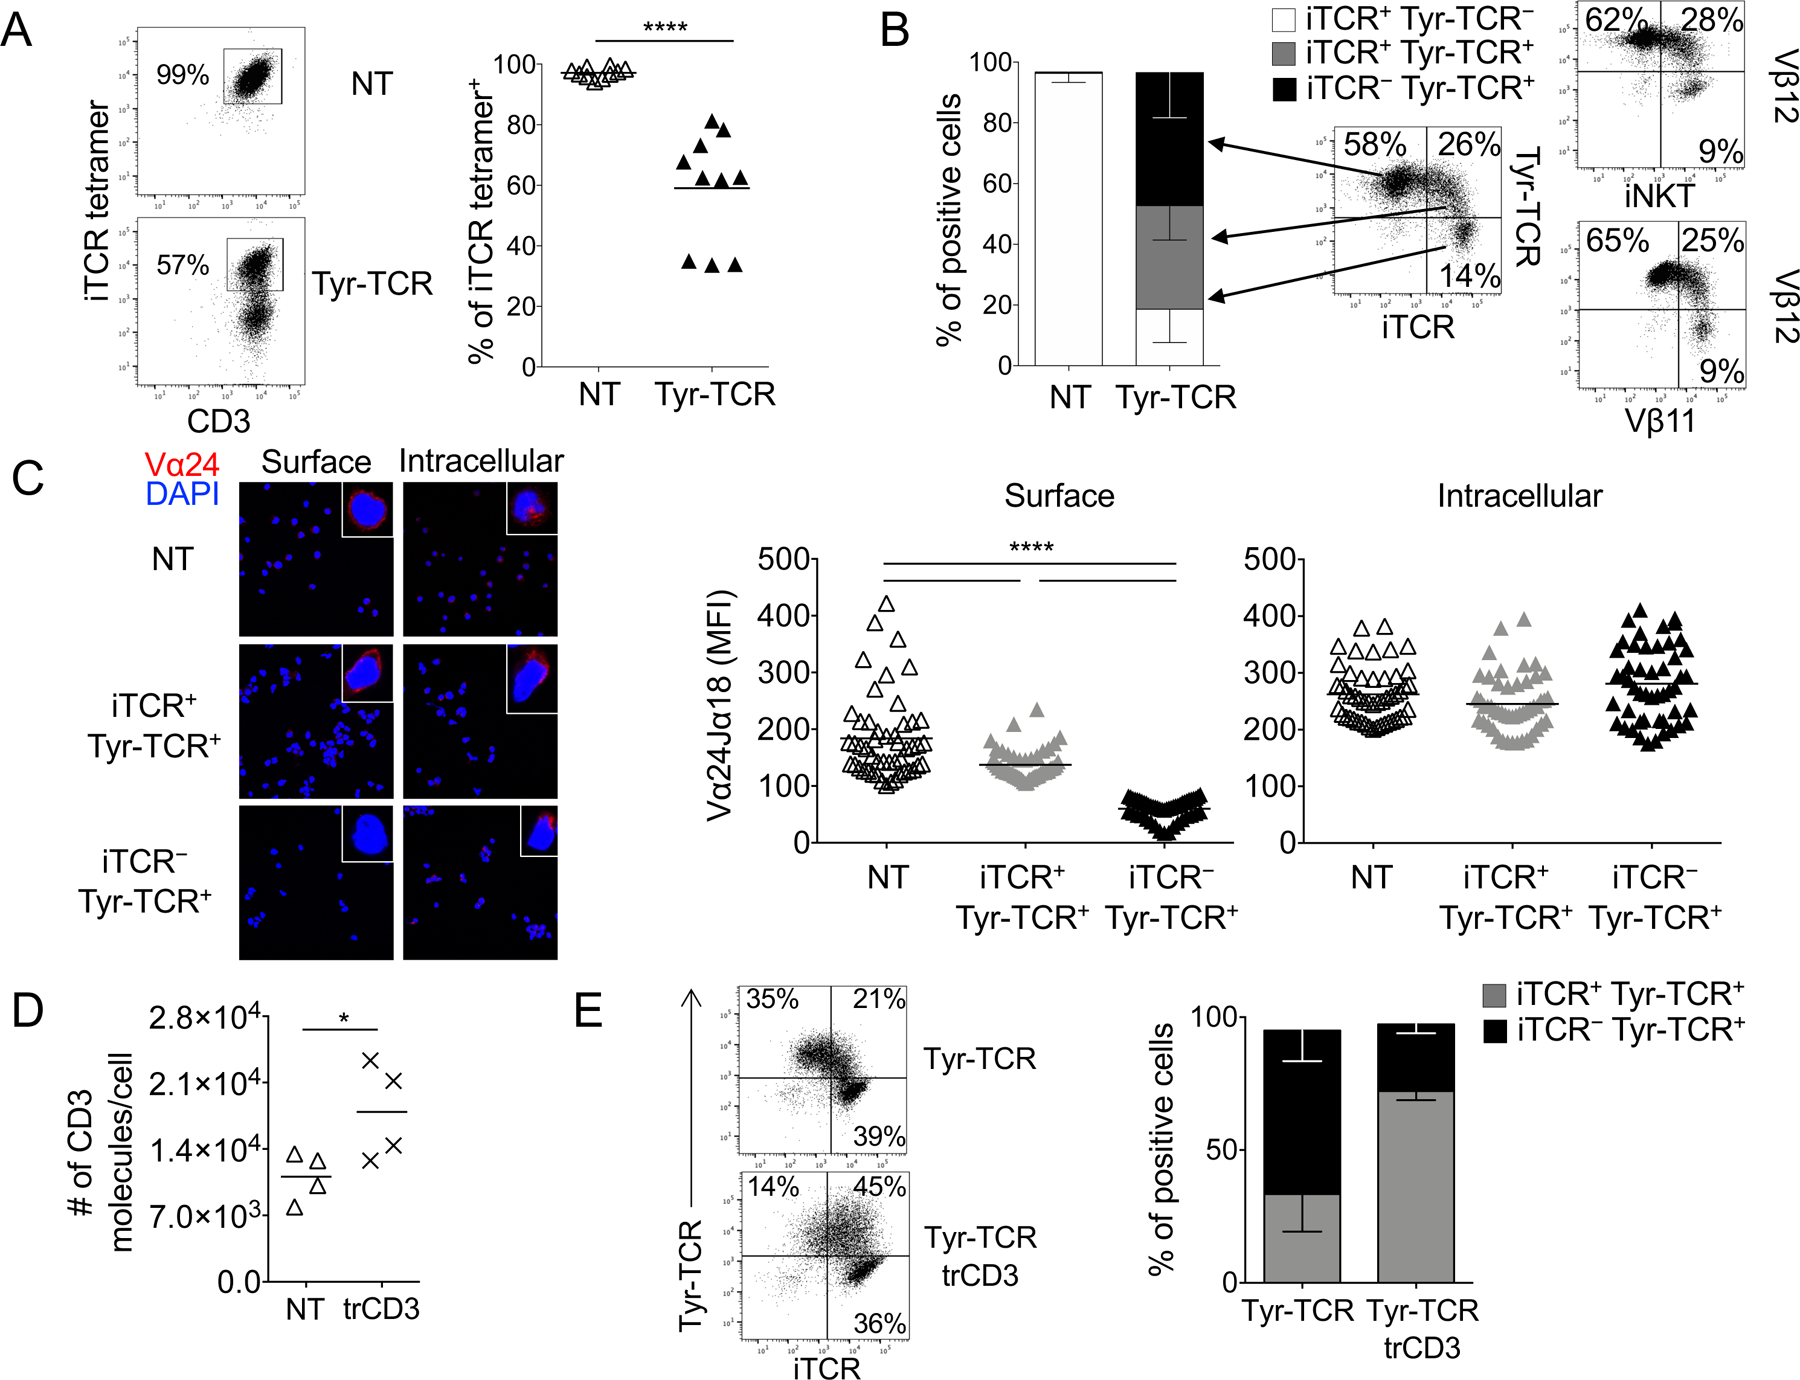
A. Representative flow cytometry plots (left panel) and summary (right panel) illustrating the expression of the iTCR in NT-NKTs and Tyr-TCR-NKTs 4 days after transduction (n=10, mean is shown). ****p<0.0001, paired t test. B. Subset composition of NT-NKTs and Tyr-TCR NKTs at the end of S2 (day 18–20) defined by expression of iTCR and Tyr-TCR detected by specific pentamers (n=10; left, SD is shown). Representative flow cytometry plots illustrating the expression of the iTCR (stained alternatively with the iTCR tetramer, anti-Vα24, or anti-Vβ11), and the Tyr-TCR (stained either with the Tyr-TCR pentamer or with anti-Vβ12)(right). C. Surface and intracellular staining of sorted iTCR+Tyr-TCR–, iTCR–Tyr-TCR+, and iTCR+Tyr-TCR+ NKT subsets with the Vα24Jα18 Ab (red staining). The blue staining indicates the DAPI. Shown are representative images of a single field of view taken via confocal microscopy (Magnification 63X). Graphs show the summary of the MFIs for surface and intracellular staining (n=50, right, mean is shown). MFI was calculated on NKTs obtained from 4 images for each condition. ****p<0.0001, unpaired t test. D. Number of CD3 molecules per cell in control NKTs (NT) and NKTs transduced with a vector encoding the CD3 complex (trd-CD3) (n=4, mean is shown). *p=0.0151, paired t test. E. Representative flow cytometry plots (left) and summary (right) illustrating the percentage of iTCR–Tyr-TCR+ and iTCR+Tyr-TCR+ cells gated on Tyr-TCR+ NKTs, in NKTs transduced with the Tyr-TCR encoding vector alone (Tyr-TCR NKTs), and in NKTs co-transduced with the vectors encoding the Tyr-TCR and CD3 (Tyr-TCR-CD3 NKTs)(n=5, SD is shown).