
Figure 4. Tyr-TCR NKTs target HLA-A2+Tyr+ cells.
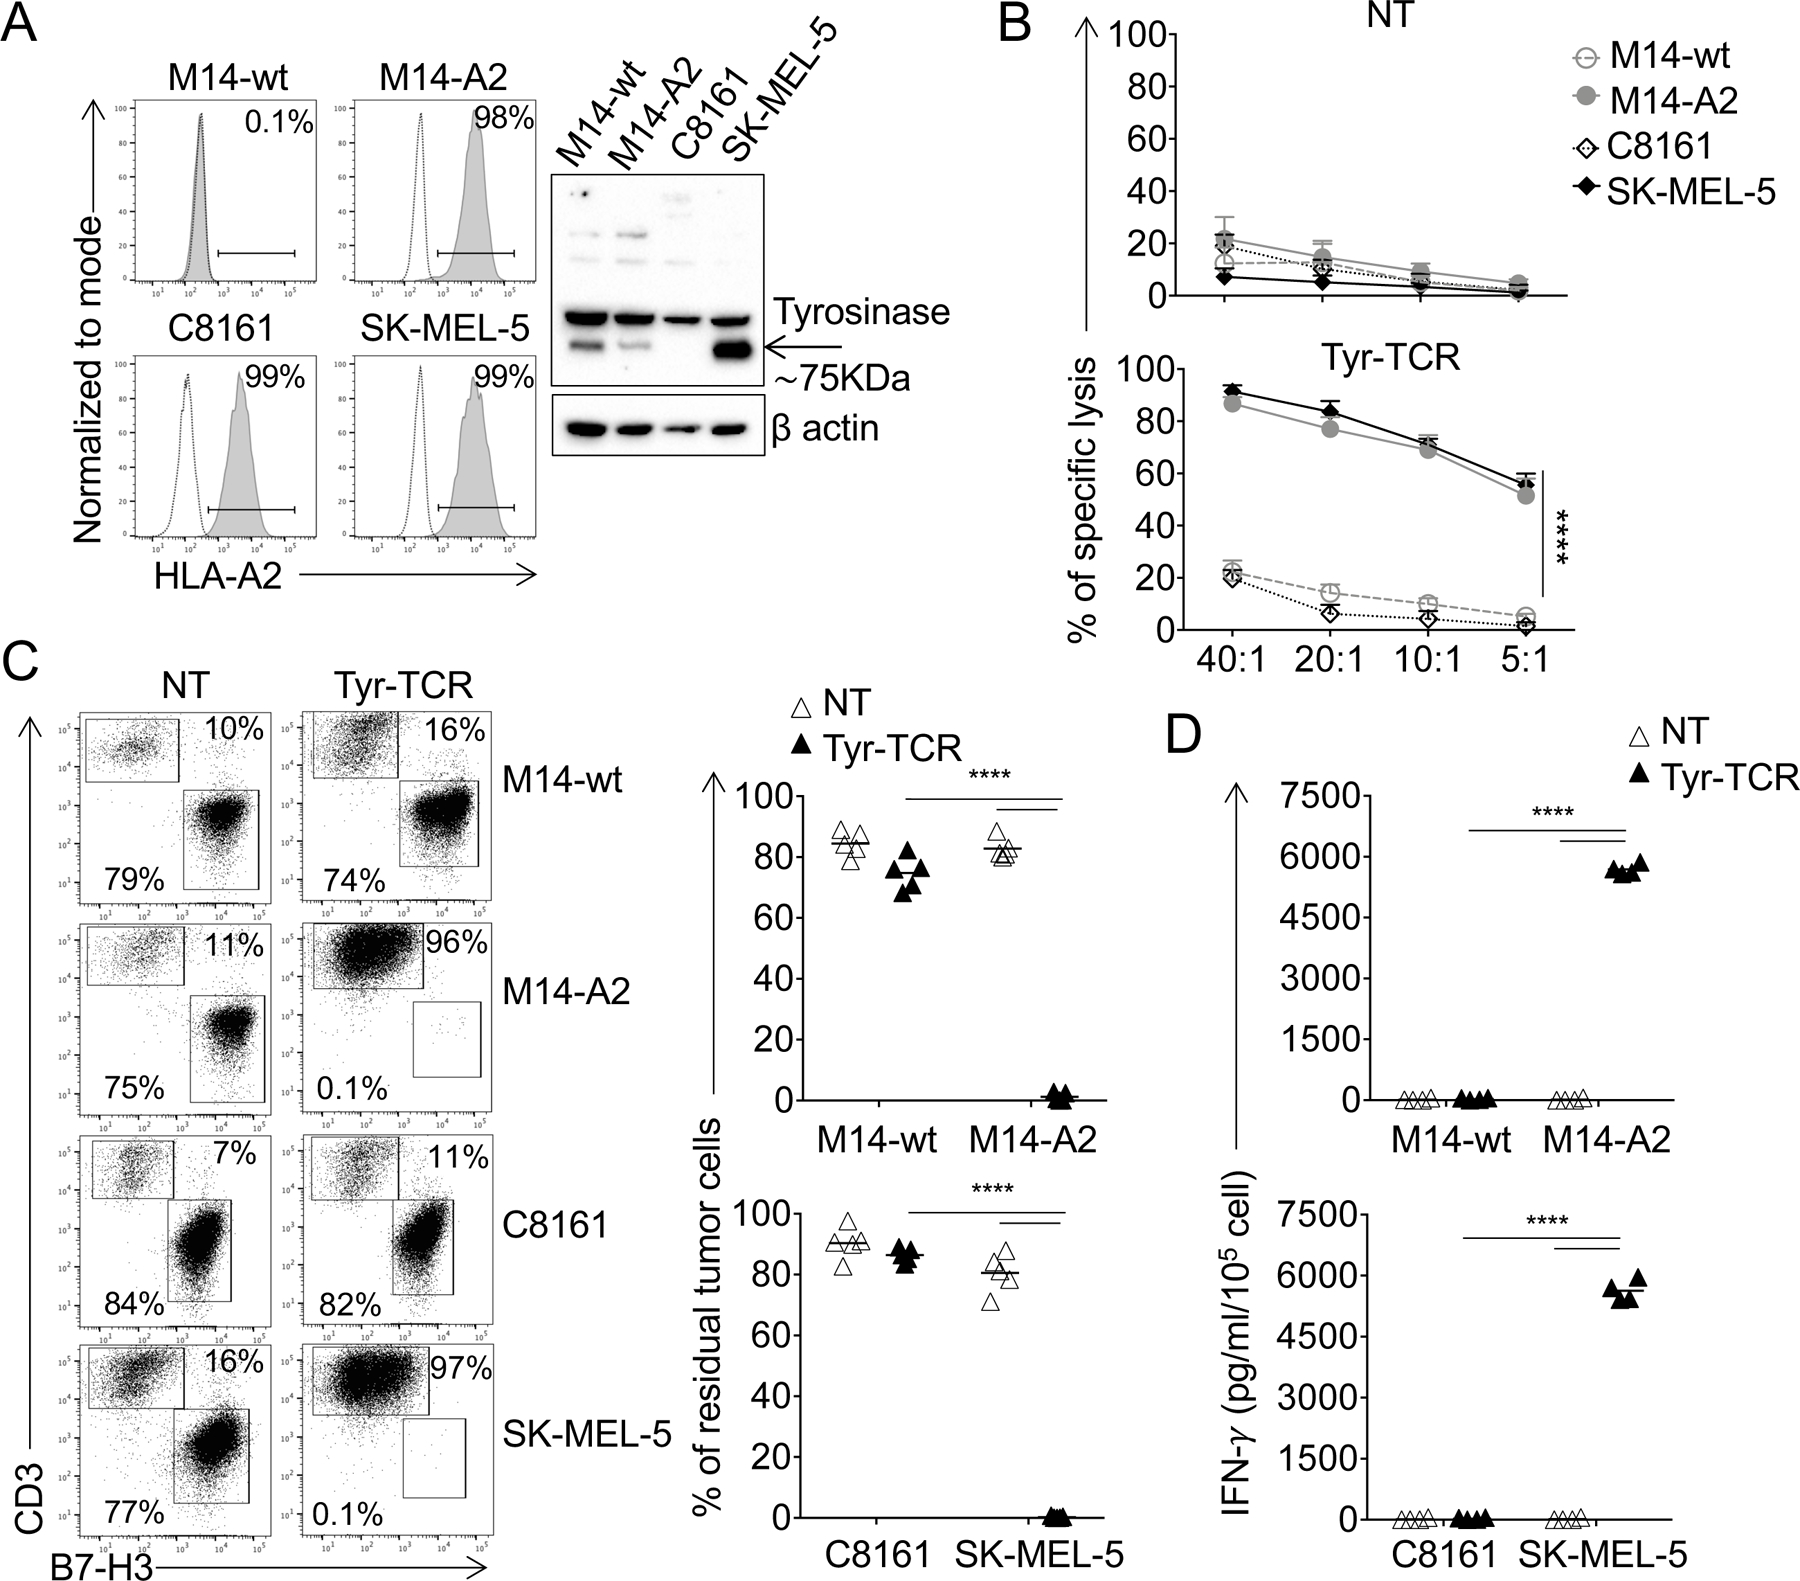
A. Expression of the HLA-A2 molecule in melanoma cell lines assessed by flow cytometry (left). Dotted and solid lines represent the isotype and HLA-A2 mAbs, respectively. The M14-wt cell line was modified to express the HLA-A2 molecule (M14-A2) via retroviral gene transfer. Detection of tyrosinase in lysates of the indicated melanoma cell lines assessed by Western blot (right). Staining for β-actin was used as a loading control. B. NT-NKTs (upper graph) and Tyr-TCR-NKTs (lower graph) were tested against the melanoma cell lines in a 5-hour 51Cr-release assay (n=4, mean and SD are shown). ****p<0.0001, 2-way ANOVA with Bonferroni correction. C. NT-NKTs and Tyr-TCR-NKTs were cocultured with melanoma cell lines (E:T=1:1) for 3 days. Cells were then collected and stained with the CD3 and CD276 mAbs to identify NKTs and melanoma cells, respectively, by flow cytometry. Representative flow plots (left) and summary of the quantification of residual tumor cells in the culture (right)(n=5, mean is shown). ****p<0.0001, paired t test. D. Quantification of IFNγ production in the supernatant collected after 24 hours of coculture of NT-NKTs and Tyr-TCR NKTs (E:T=1:1)(n=4, mean is shown). ****p<0.0001, paired t test.