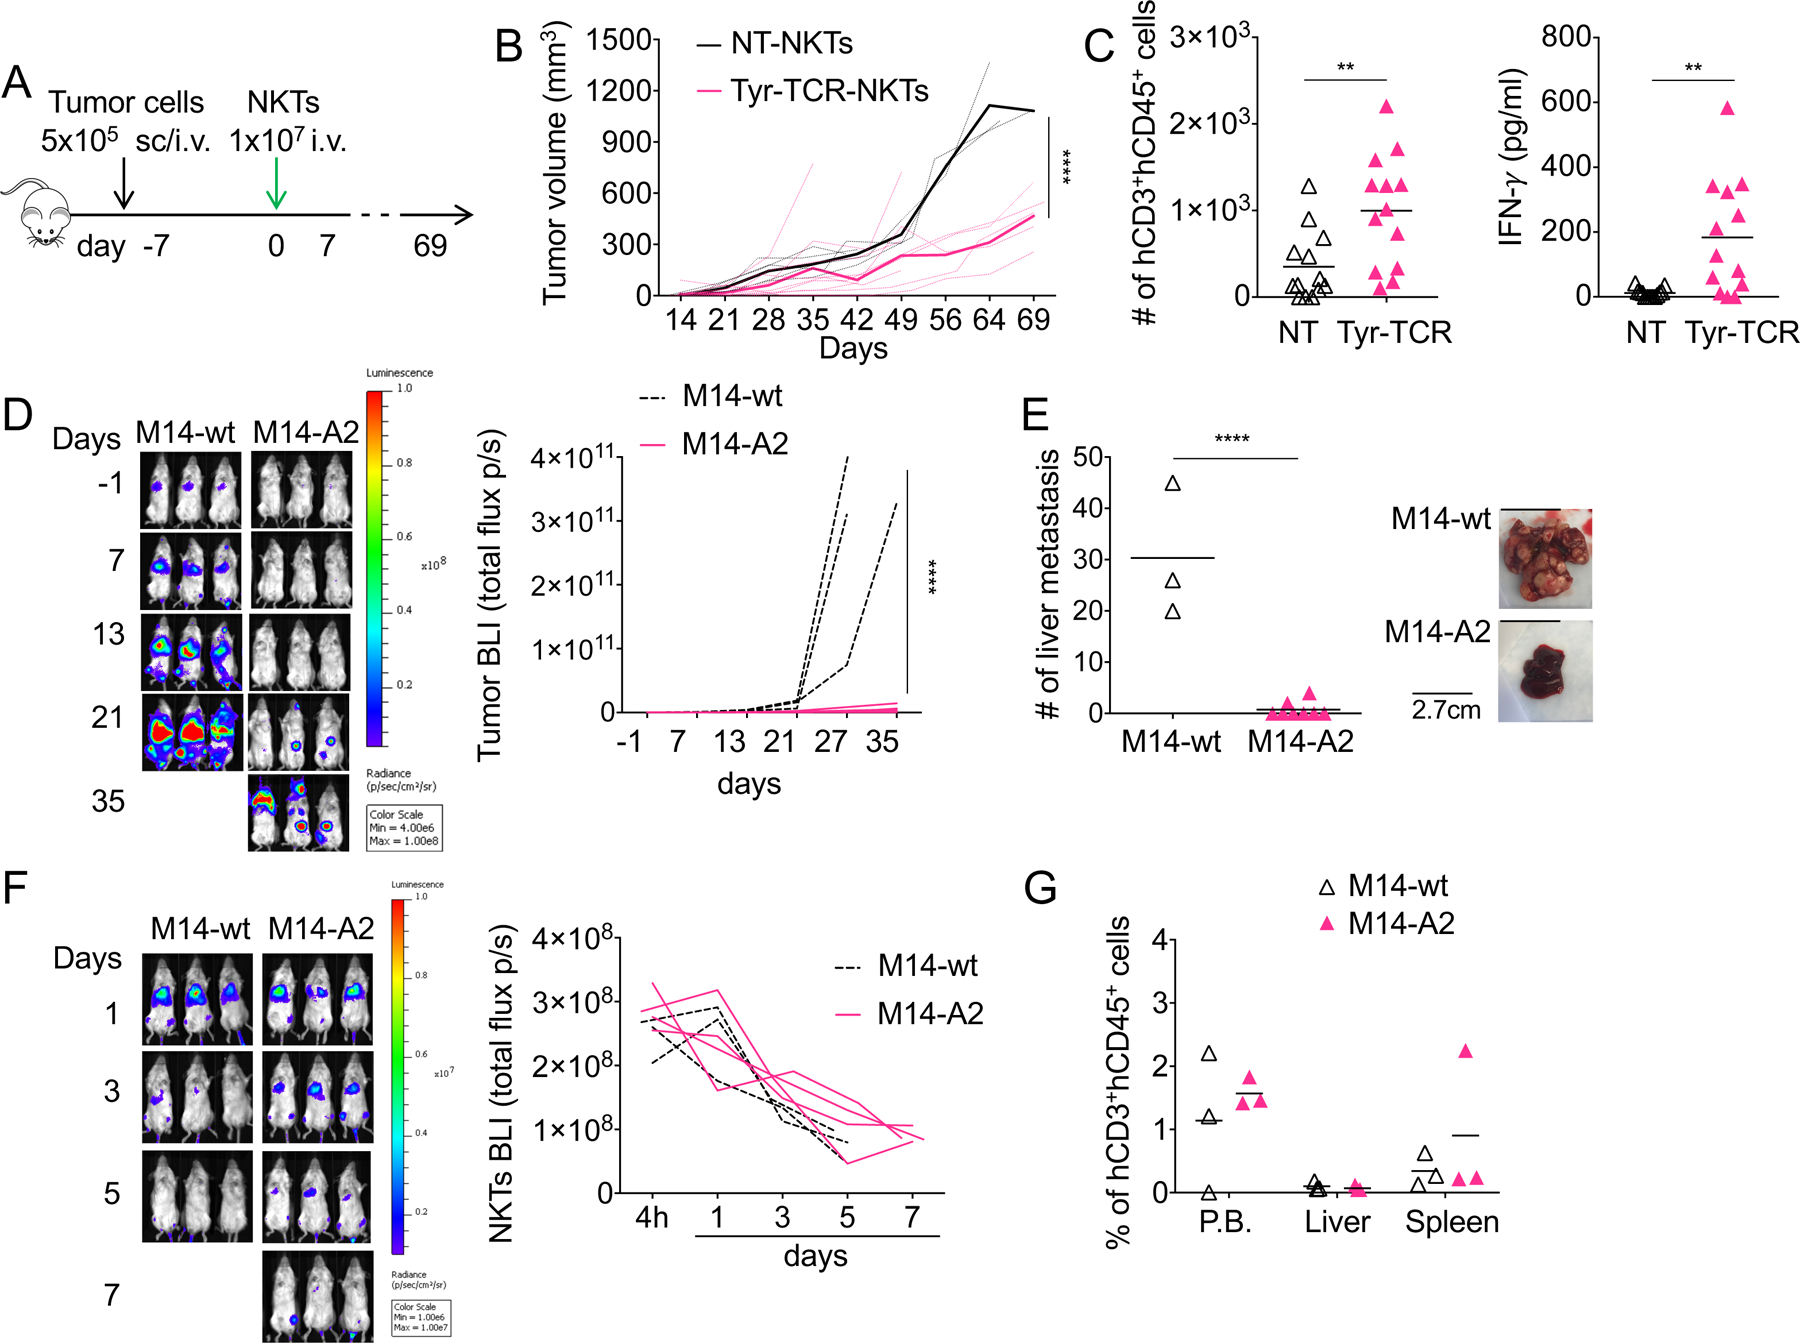
Figure 6. Tyr-TCR-NKTs control the growth of HLA-A2+Tyr+ cells in vivo.

A. Schema of the xenograft tumor model in NSG mice engrafted subcutaneously (s.c.) with SK-MEL-5 cells or intravenously (i.v.) with M14 cells and treated one week later with NKTs. B. Tumor growth in mice engrafted s.c. with SK-MEL-5 tumor cells and treated with NT-NKTs (n=5) or Tyr-TCR NKTs (n=10). Dotted lines represent individual mice, bolded solid lines represent the mean for the group. ****p<0.0001, 2-way ANOVA with Bonferroni correction. C. Quantification of human CD3+CD45+ cells (left) and IFNγ (right) in each tumor harvested from mice engrafted with SK-MEL-5 tumor cells and treated with either NT-NKTs (n=13) or Tyr-TCR NKTs (n=13) (mean is shown). **p=0.0055 and **p=0.0021, respectively, unpaired t test. D. Representative tumor bioluminescence (BLI)(left)(Color scale: Min=4.00e6, Max=1.00e8) and BLI kinetics of all treated mice (right) engrafted intravenously (i.v.) with eGFP-FFLuc-labeled M14-wt (n=3) or M14-A2 (n=8) tumor cells. ****p<0.0001, 2-way ANOVA with Bonferroni correction. E. Mice engrafted with eGFP-FFLuc-labeled M14-wt (n=3) or M14-A2 (n=8) and treated with Tyr-TCR NKTs were euthanized and tumor liver metastases counted (left) (mean is shown). Representative images of the livers (right). ****p<0.0001, unpaired t test. F. Mice were infused i.v. with 1 × 10⁶ M14-wt or M14-A2 cells, and after 7 days, they were injected with 1 × 10⁷ Tyr-TCR NKTs labelled with eGFP-FFluc. Representative Tyr-TCR-NKTs BLI (left))(Color scale: Min=1.00e6, Max=1.00e7), and BLI kinetics of all mice (right) of M14-wt (n=3) or M14-A2 (n=4) tumor-bearing mice. G. Quantification of human CD3+CD45+ cells the in peripheral blood (P.B.), liver, and spleen of M14-wt (n=3) or M14-A2 (n=3) tumor bearing mice treated with Tyr-TCR NKTs (mean is shown).
