FIGURE 1.

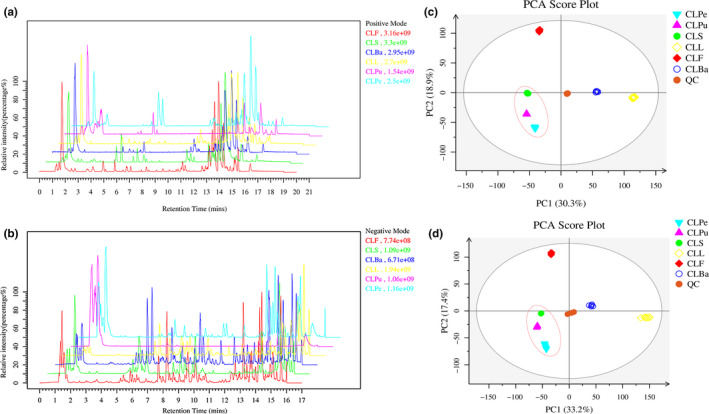
Base peak ion (BPI) chromatograms of different parts of wampee in positive (a) and negative (b) modes. Principal component analysis (PCA) of different parts of wampee in positive (c) and negative (d) modes

Base peak ion (BPI) chromatograms of different parts of wampee in positive (a) and negative (b) modes. Principal component analysis (PCA) of different parts of wampee in positive (c) and negative (d) modes