
FIGURE 2.
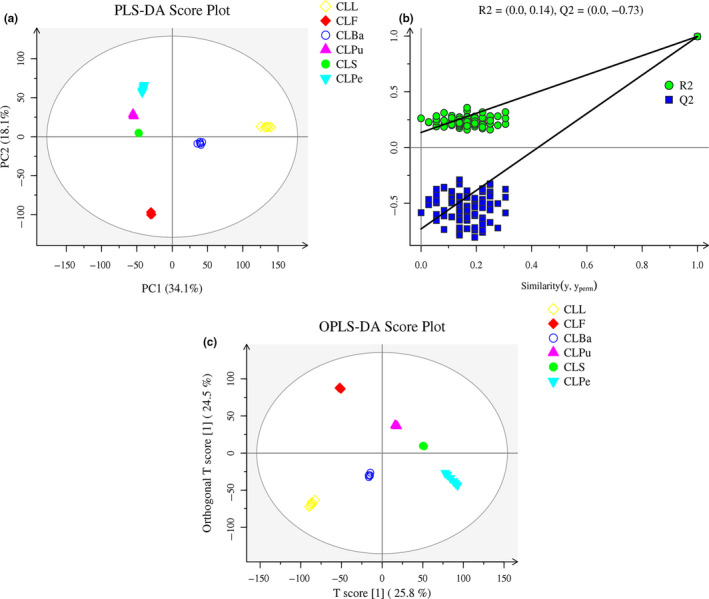
Partial least squares‐discriminate analysis (PLS‐DA) of different parts of wampee in negative mode (a). Permutations plot of the PLS‐DA model for the CLL versus CLF versus CLBa versus CLPu versus CLS versus CLPe (b). Orthogonal projections to latent structures discriminant analysis (OPLS‐DA) of different parts of wampee in negative mode (c). (CLF, CLBa, CLL, CLPe, CLPu, and CLS represent the flowers, barks, leaves, peels, pulps, and seeds of wampee)