
FIGURE 10.
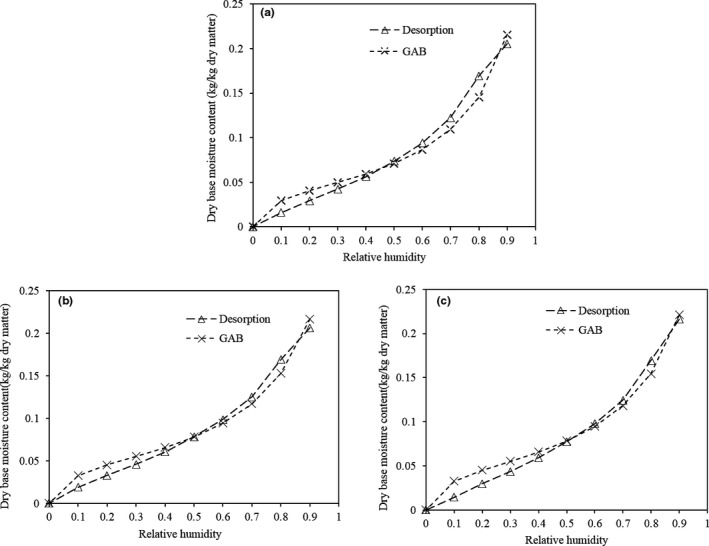
Comparison of desorption curves between experimental curves and GAB models for dehydrated potato cubes subjected to citric acid pretreatment followed by drying at 50°C. a: 0.1% citric acid, b: 0.2% citric acid, and c: 0.3% citric acid
Official websites use .gov
A
.gov website belongs to an official
government organization in the United States.
Secure .gov websites use HTTPS
A lock (
) or https:// means you've safely
connected to the .gov website. Share sensitive
information only on official, secure websites.
Comparison of desorption curves between experimental curves and GAB models for dehydrated potato cubes subjected to citric acid pretreatment followed by drying at 50°C. a: 0.1% citric acid, b: 0.2% citric acid, and c: 0.3% citric acid