
Figure 2.
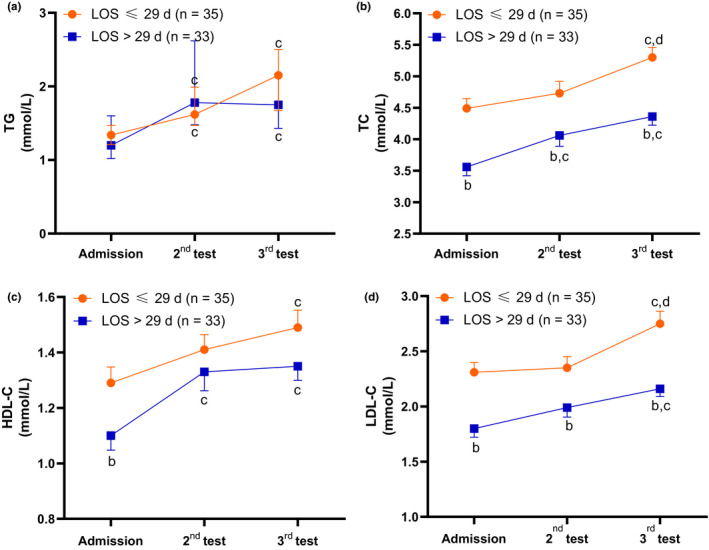
Changes in the serum lipid profile during hospitalization; (a) Data are shown as the median (bar = IQR); (b–d) Data are shown as the mean (bar = standard error); (b) p < .05, versus LOS ≤ 29 days group; (c) p < .05, versus at admission; (d) p < .05, versus 2nd test