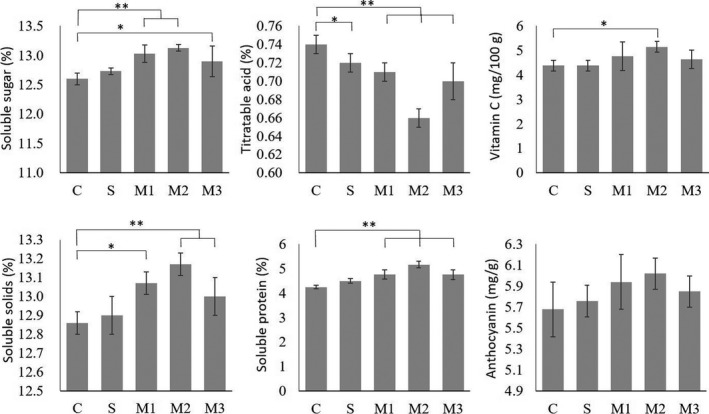
FIGURE 2.

Soluble sugar content (%), titratable acid content (%), vitamin C content (mg/100g), soluble solids content (%), soluble protein content (%), and anthocyanin content (mg/g) of blueberry under different treatments. C: blank control; S: JC65; M1: JC65 + 7ze3 + JC03; M2: JC65 + HS10 + 7ze3; M3: JC65 + JC03 + HS10. Significant differences are marked as: “*” for p < .05, “**” for p < .01
