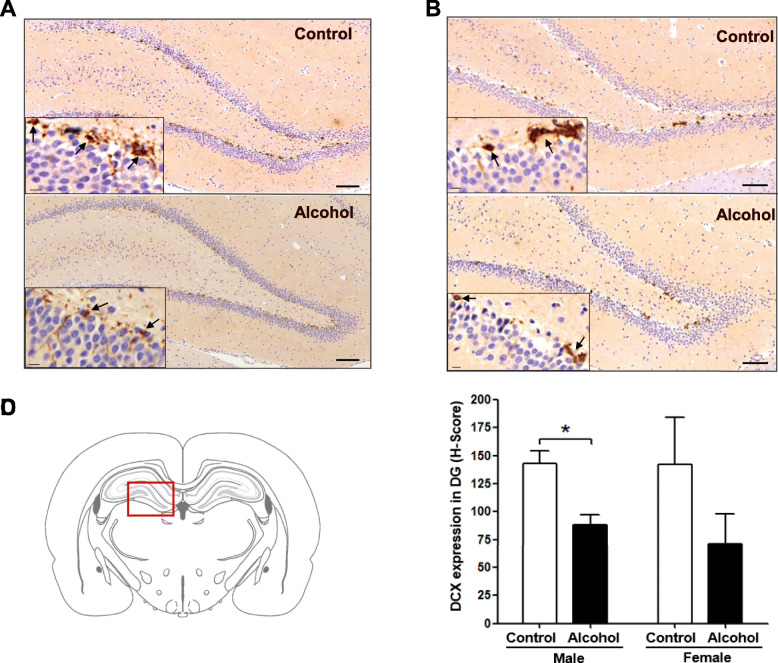
Fig. 2.
Expression of DCX in the hippocampi of male and female rats. a DCX expression in the hippocampi of male rats (n = 3). b DCX expression in the hippocampi of female rats (n = 3). Scale bar = 100 μm (insert: 10 μm). Black arrows indicate high DCX-expressing cells. c Rat brain atlas. The red square is the hippocampal dentate gyrus (DG) region where neurogenesis occurs and where DCX expression was measured. d The percentage of cells that are positive for DCX is expressed as H-score. *Significantly different from male control group (*p < 0.05)

