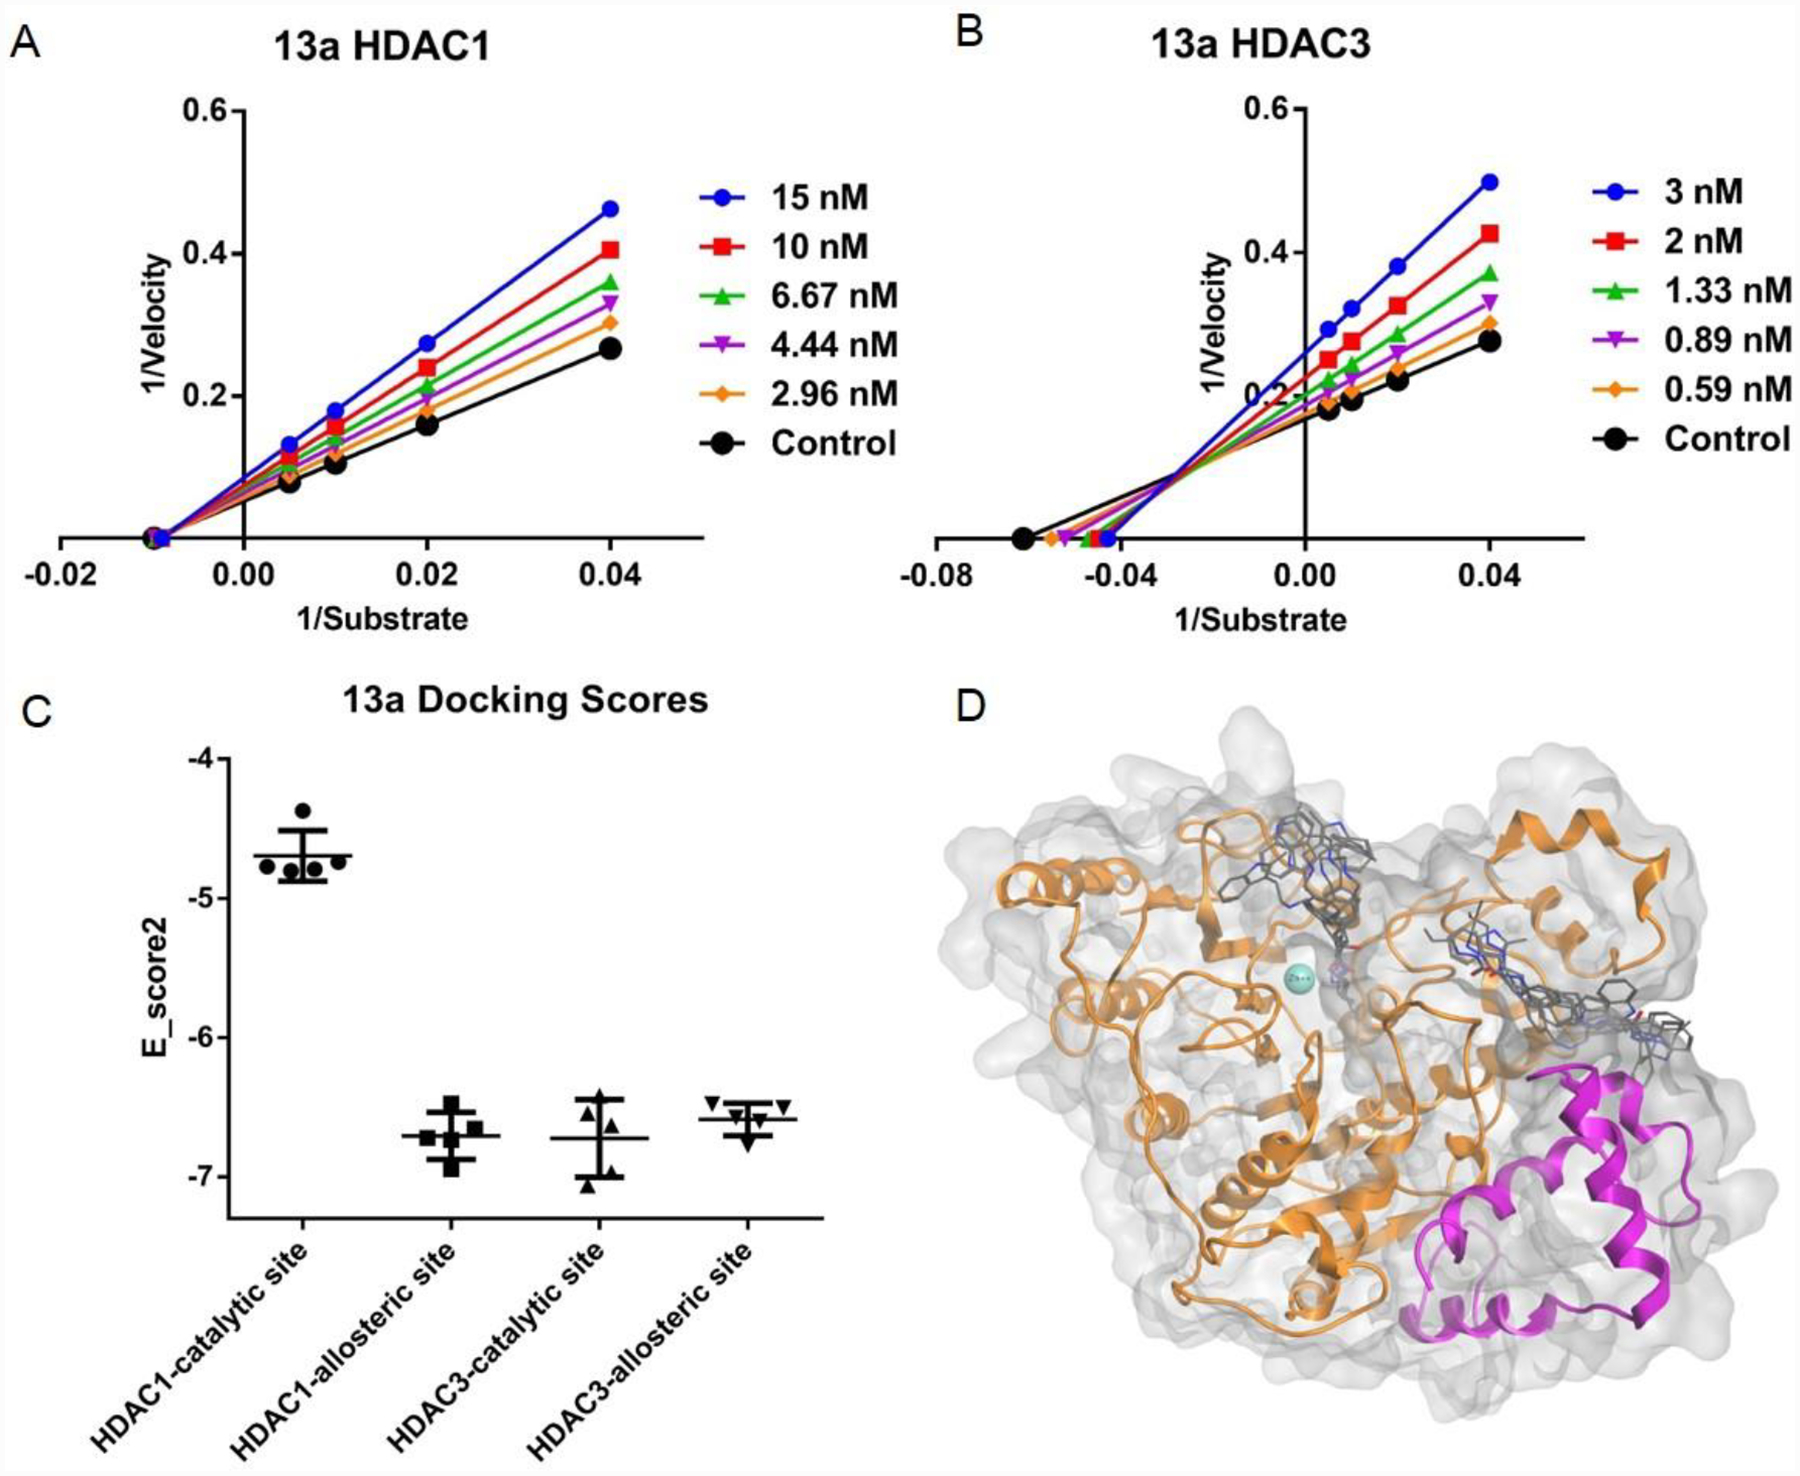
Figure 2A and B:

Lineweaver-Burke plots of enzyme kinetics data in the presence of inhibitors. Y-axes units: (pmoles acetylated substrate cleaved/min)−1, Xaxes units: (μmoles)−1. Compound 13a for HDAC1, and 3, respectively. Intersection on Xaxes are indicative of non-competative inhibition (HDAC1, 3A), while intersections in 2nd quadrant are indicative of mixed and competitive inhibition (HDAC3, 3B). Representative plots of n ≥ 3 experiments. 2C. Molecular docking probe of the catalytic and allosteric binding pockets of HDAC1 (PDB: 5ICN) and HDAC3 (PDB: 4A69). Data is represented as whisker plot using the top 5 docking poses for each condition. The catalytic site was defined as the catalytic pocket that incorporated the Zn metal iron, and the allosteric site was defined as the allosteric pocket created by the interface between the HDAC heterodimer. 2D. Potential binding mode of 13a with catalytic site and allosteric site of HDAC3 in silico. Top 5 docking poses for each site are displayed.
