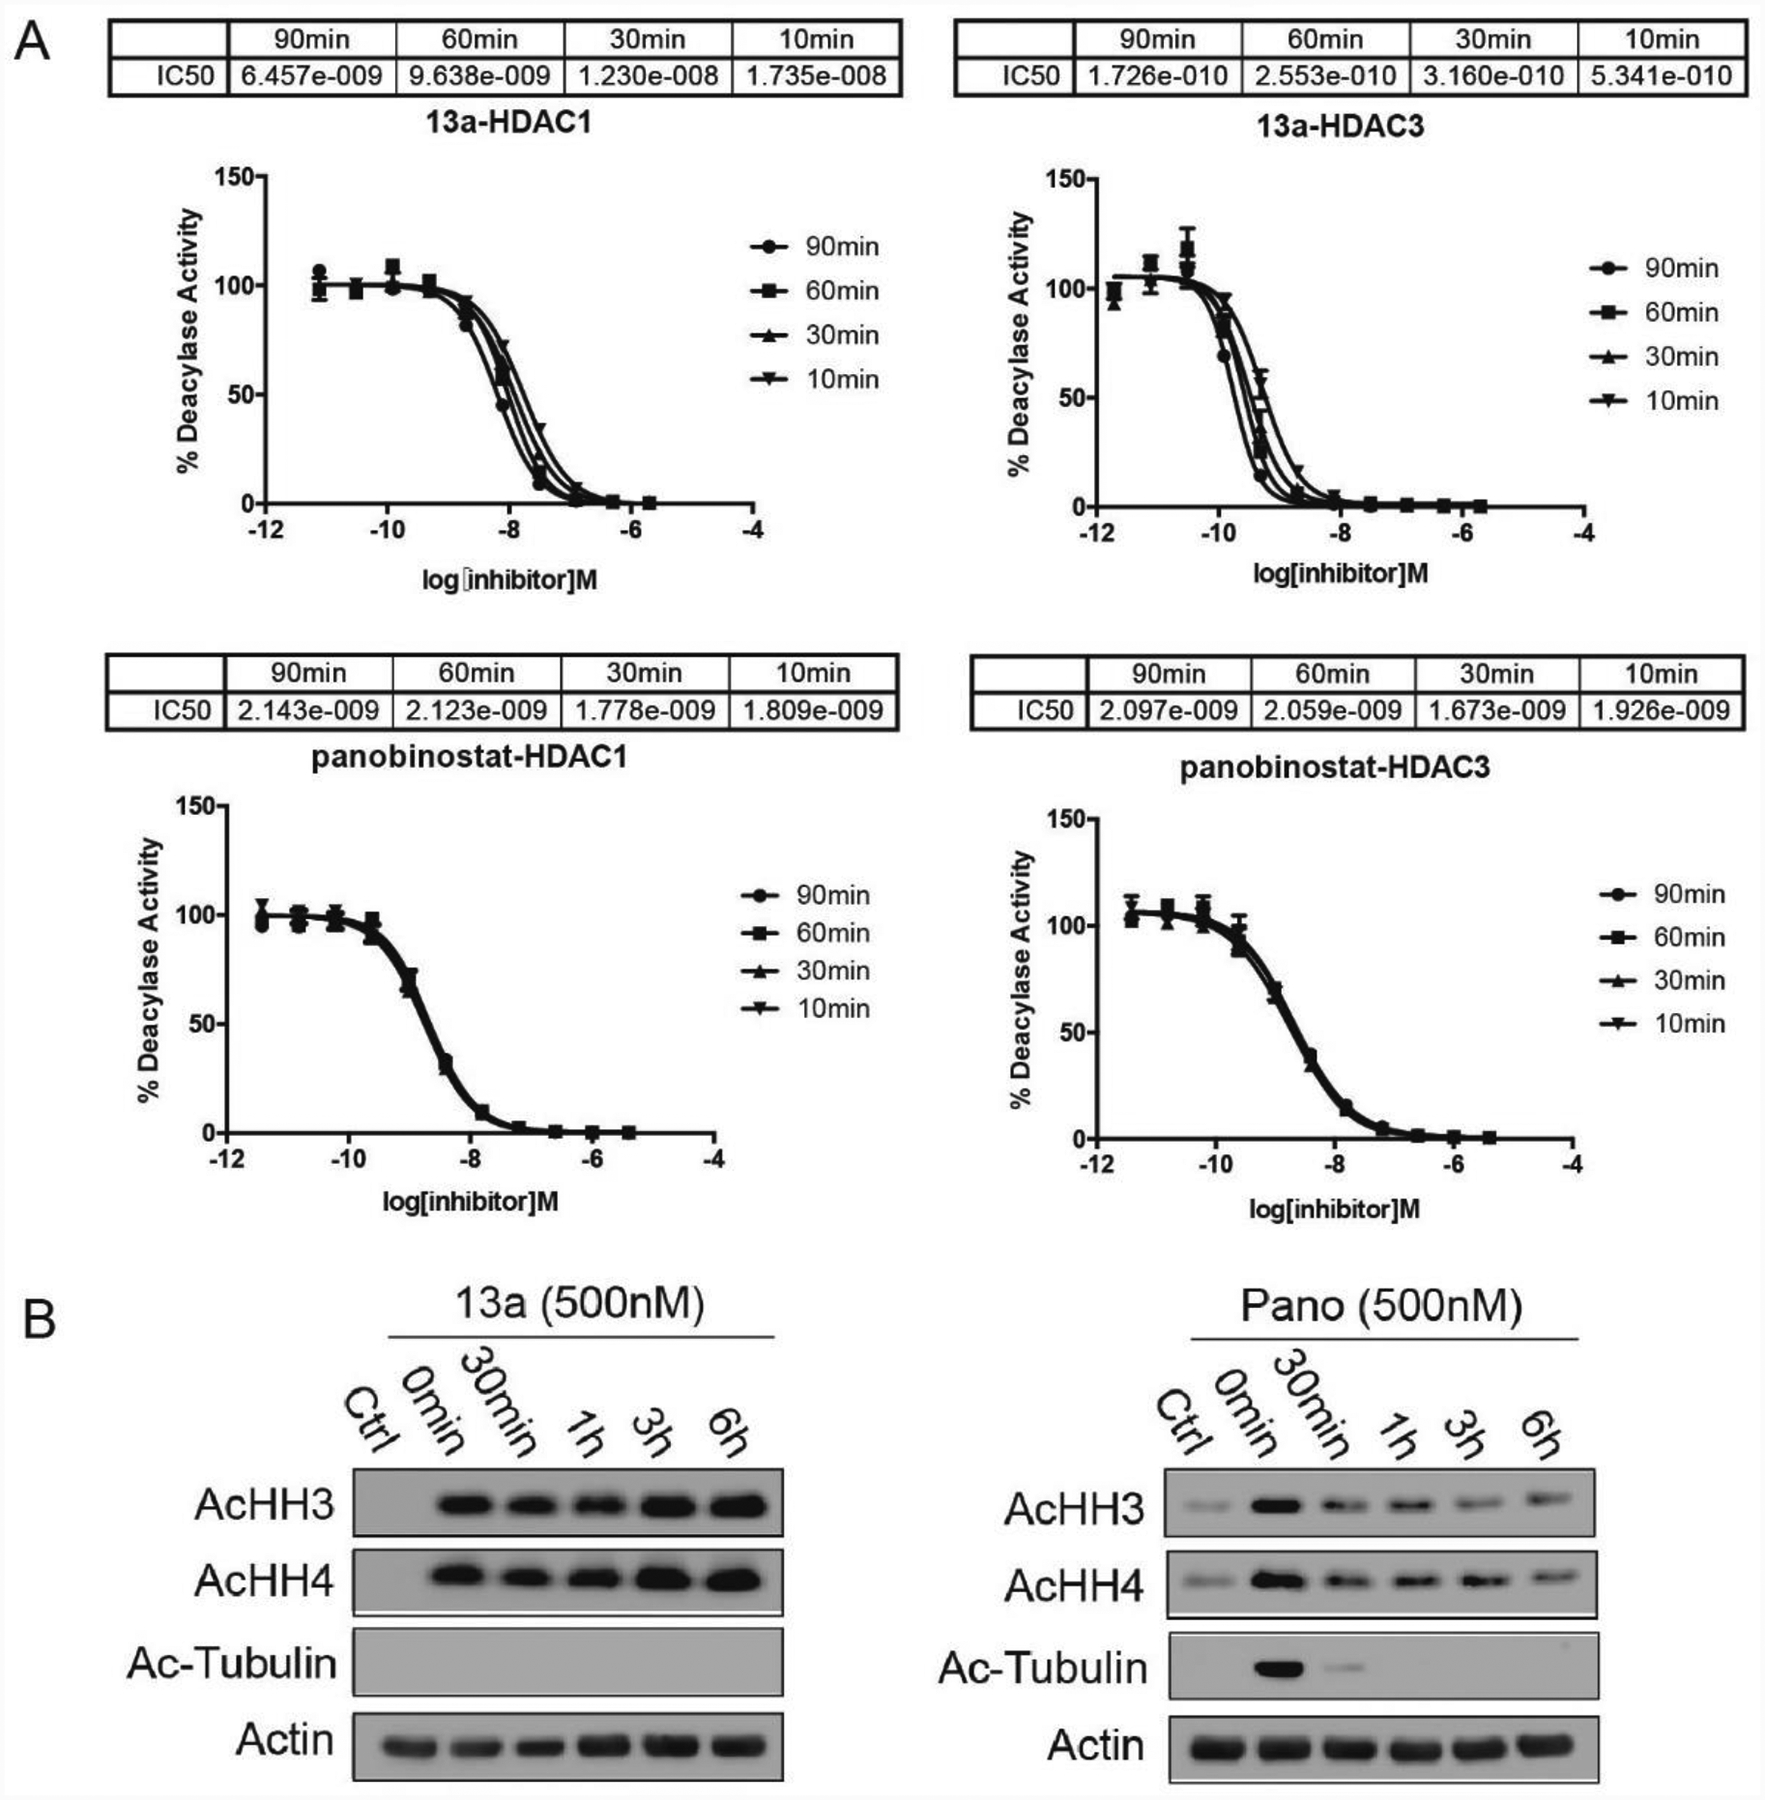
Figure 3A:

IC50 curves of 13a and panobinostat for HDACs 1, 2, and 3 after pre-incubation of 10 min, 30 min, 60 min, and 90 min, respectively. 13a shows time-dependent inhibition toward HDAC1 and 3, which indicates slow-on inhibition; while panobinostat reaches a steady-state with 10 min pre-incubation, indicating fast-on kinetics. Dose response curves for 13a and panobinostat performed in triplicates were generated using GraphPad Prism software. 3B: Histone acetylation caused by 13a does not reduce within 6 h of drug removal, while panobinostat reduces acetylation within 30 min after removal of drug. MV4–11 cells are treated with 13a or panobinostat (Pano) for 3 h, control cells are collected for the 0 min point, the drugs are washed out and the cells are cultured for various lengths of time.
