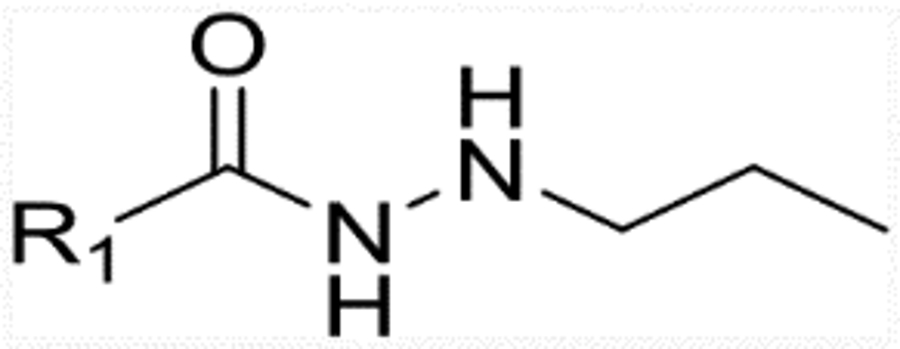
Table 1.
Structure IC50 of compounds in series 1 against HDAC1, 2, 3 and 6.
| Compound No. | R1 | IC50 (nM)a | |||
|---|---|---|---|---|---|
| HDAC1 | HDAC2 | HDAC3 | HDAC6 | ||
| 12a |  |
180.9 | 1298 | 16.76 | >50,000 |
| 13a |  |
5.17 | 49.5 | 0.28 | >50,000 |
| 15a |  |
28.84 | 278.6 | 12.59 | >50,000 |
| 16a |  |
29.43 | 107.5 | 19.94 | >50,000 |
| 15b |  |
2524 | > 5000 | > 5000 | >50,000 |
| 16b |  |
1674 | 4942 | 673.9 | >50,000 |
| 15c |  |
216.5 | 579.3 | 78.14 | >50,000 |
| 16c |  |
87.98 | 441.3 | 96.71 | >50,000 |
| 24a |  |
15.8 | 67.48 | 6.12 | >50,000 |
| 24b |  |
93.05 | 474.1 | 48.75 | >50,000 |
| 24c |  |
56.32 | 174.6 | 24.82 | >50,000 |
| Panobinostat | 2.5 | 13.2 | 2.1 | 10.5 | |
| SAHA | 43.76 | 89.23 | 144.7 | 78.3 | |
Values are average of three independent determinations, the SD values are < 20% of the mean.

