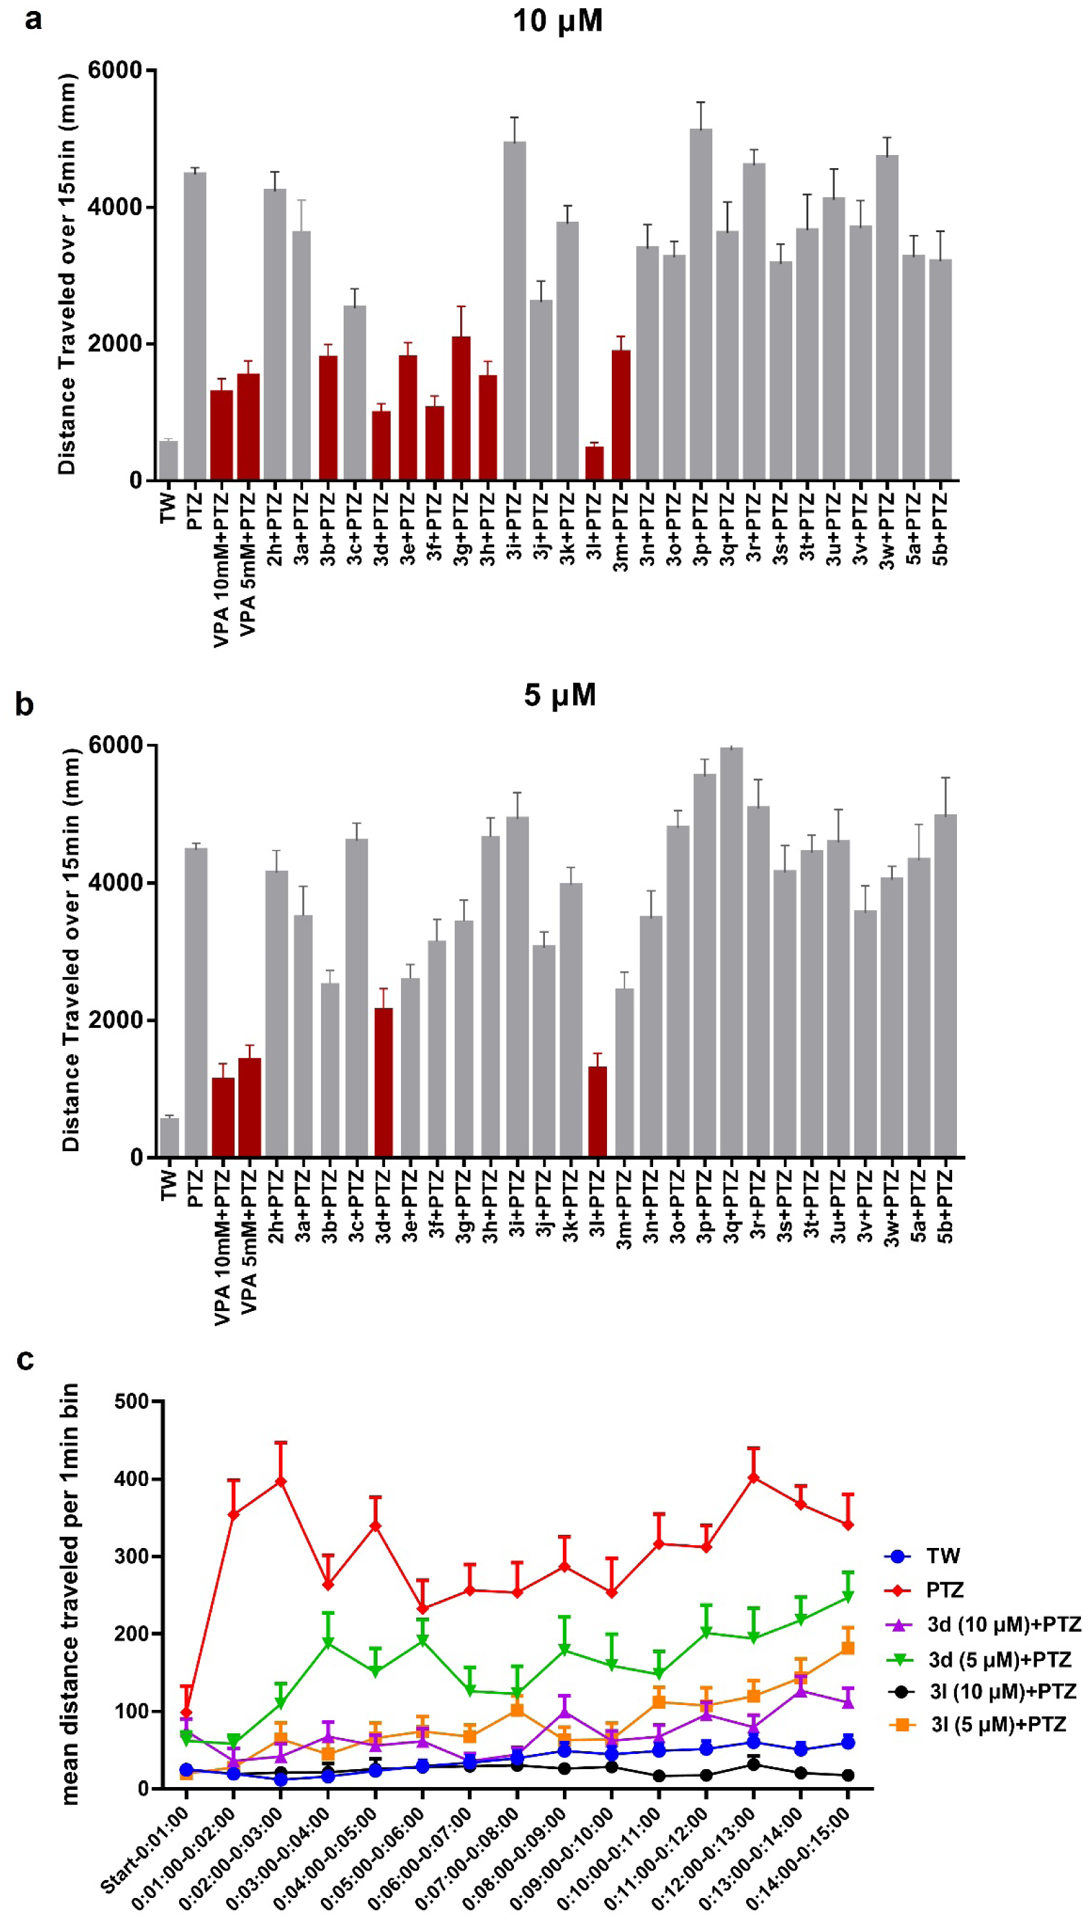
Figure 2.

(a) and (b) Total mean distance traveled over 15 min. Synthesized compounds were tested at 10 μM and 5 μM, respectively. 5 mM and 10 mM VPA were used as positive controls. Data represents the mean distance traveled, error bar represents SEM, n = 8 for each group. The red color shows > 50% percentage of reduced travel distance (c) Mean distance traveled per 1 min after treatment of 3d and 3l, data are shown as mean distance traveled, error bar represents SEM, n = 8 for each group. With the exception of 3d at 10 μM + PTZ, all time points are significantly different from the positive PTZ run p < 0.01. TW = tank water only control.
