Figure 5.
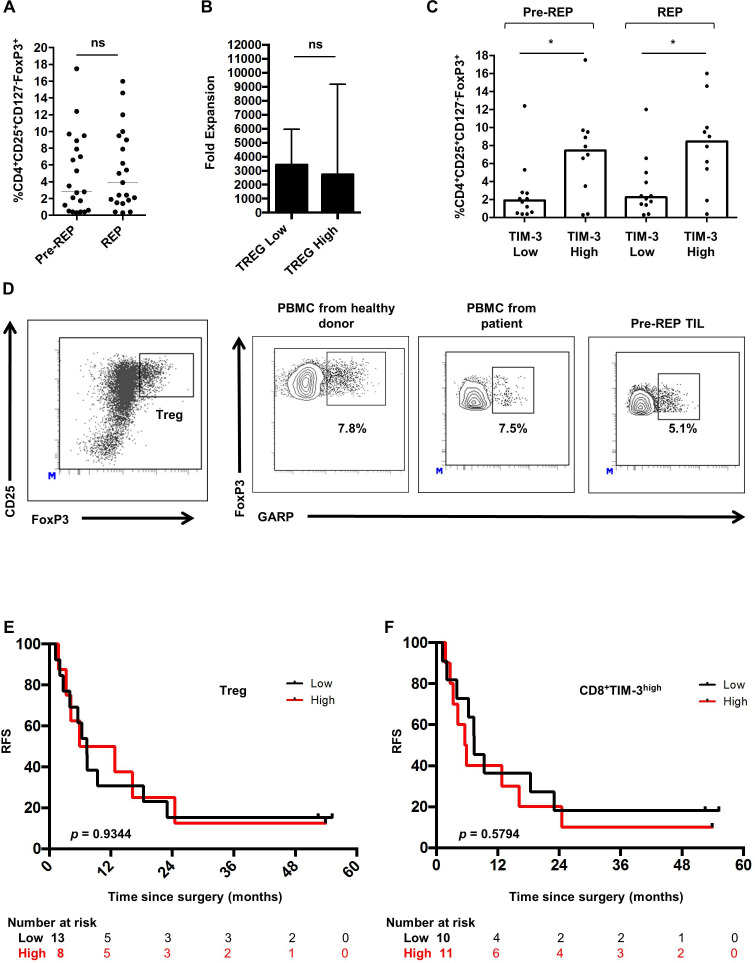
Characterization of Treg within T-cell cultures. (A) Regulatory T cells (Treg) was investigated by intracellular staining for FoxP3 on the CD4+CD25HighCD127− population before and after the rapid expansion protocol (REP) (p=0.2921). (B) Median fold expansion in Treg low and in Treg high culture. There was no significant difference (p=0.5920) (C) Percentage of Treg before and after REP according to T cell immunoglobulin mucin domain-containing protein 3 (TIM-3) expression on CD8 T cells. (D) Glycoprotein-A repetitions predominant (GARP) expression (%) on Treg within peripheral blood mononuclear cells isolated from healthy donors, patients with metastatic colorectal cancer (mCRC) and match Pre-REP T cells. Plots are representative of at least five experiments. (E, F) Kaplan-Meier curve for relapse free survival () according to the percentage of (E) Treg and (F) CD8+TIM-3+ T cells (low vs high) in Pre-REP T cell cultures following resection of liver metastases from patients with mCRC. Log-rank test was used for the comparison of survival curves. Mann-Whitney tests: *p<0.05, ns, not significant; PBMC, peripheral blood mononuclear cells; TIL, tumor-infiltrating lymphocytes.

