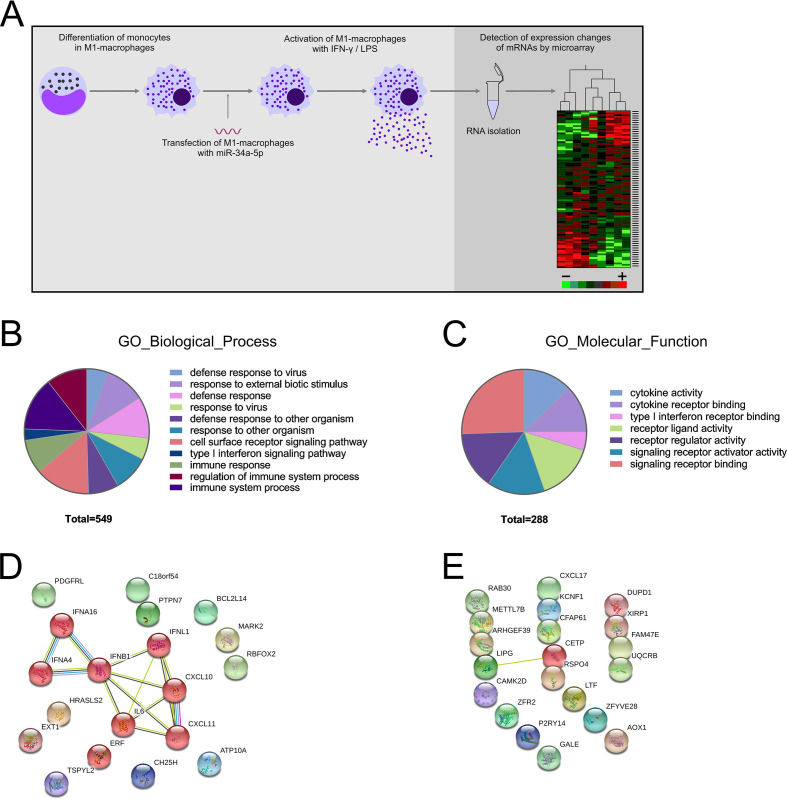
Figure 1.
Gene expression analysis of the effects of miR-34a-5p over-expression in M1 macrophages. (A) Experimental workflow. (B-C) Over-representation analysis of 296 mRNAs, which were at least 1.5-fold downregulated on miR-34a-5p over-expression by GeneTrail3. (B) Representative significant enriched pathways in Gene Ontology (GO) category “biological process.” (C) Representative significant enriched pathways in the GO category “molecular function.” (D) Protein–protein interaction networks of the 20 most downregulated mRNAs using the STRING database V.11 (https://string-db.org/). (E) Protein–protein interaction networks of the 20 most upregulated mRNAs using the STRING database V.11.

