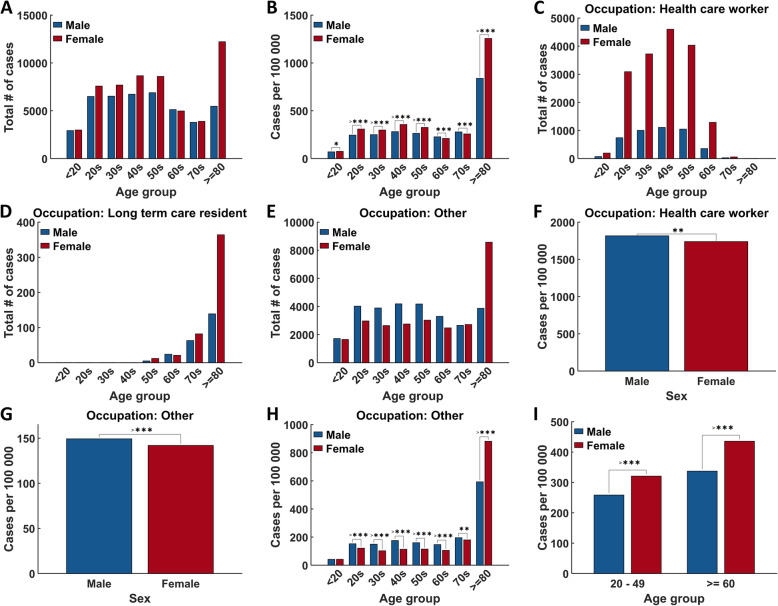
Fig. 2.
Age, sex, and occupation disaggregated COVID-19 incidence rates. A) Age/sex distribution of patients from ‘All cases’. B) Age/sex distribution of patients from ‘All cases’ normalized to population demographics. C-E) Age distribution of patients with occupation. Occupation “Other” refers to all occupations except health care workers, long-term care residences, and school/daycare workers/attendees. F) Sex disaggregated Health care worker cases normalized to workforce population demographics (any degree/certificate, all ages, male/female, ‘3 Health occupations’). G, H) Sex and/or age disaggregated ‘Occupation: Other’ cases normalized to Canadian population demographics. I, J) Age disaggregated into female reproductive age (20–49) and postmenopausal age (> = 60) for ‘All cases’ (I) and ‘Occupation: Other’ cases (J). All data was sampled from the ‘All cases’ group. Demographic normalized data was analyzed using X2 goodness-of-fit. *p < 0.05, **p < 0.01, ***p < 0.001, >***p < 0.0001

