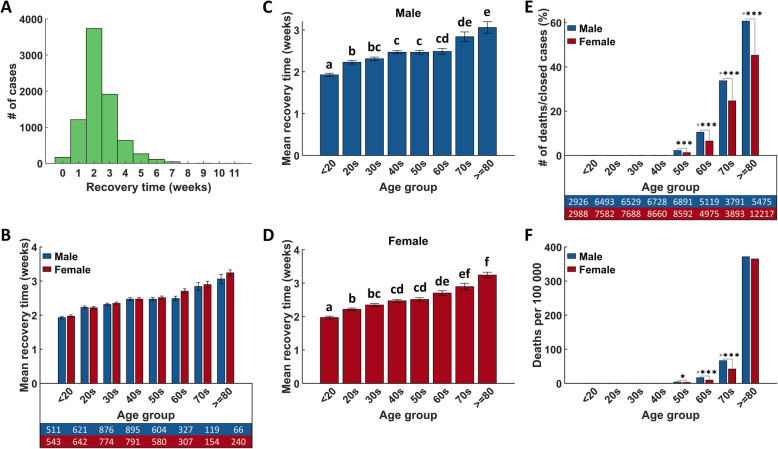
Fig. 5.
Recovery and death statistics of age and sex disaggregated COVID-19 cases. A) Histogram of recovery time. B-D) Sex/age disaggregated recovery time analyzed with one- or two-way ANOVA followed by Tukey’s multiple comparisons. Different letters above bars denote statistical significance (p < 0.05). Data represent mean ± SEM. E) Percentage of deaths relative to total number of closed cases per sex in each age group analysed with Fisher’s Exact Test. F) Death incidence normalized to Canadian population and analysed with X2 test. The tables represent the total number of cases with a recovered (B) or survival outcome (E) ordered by age group (left to right) and sex (male top, female bottom). All data were sampled from ‘Closed cases’. *p < 0.05, ***p < 0.001, >***p < 0.0001

