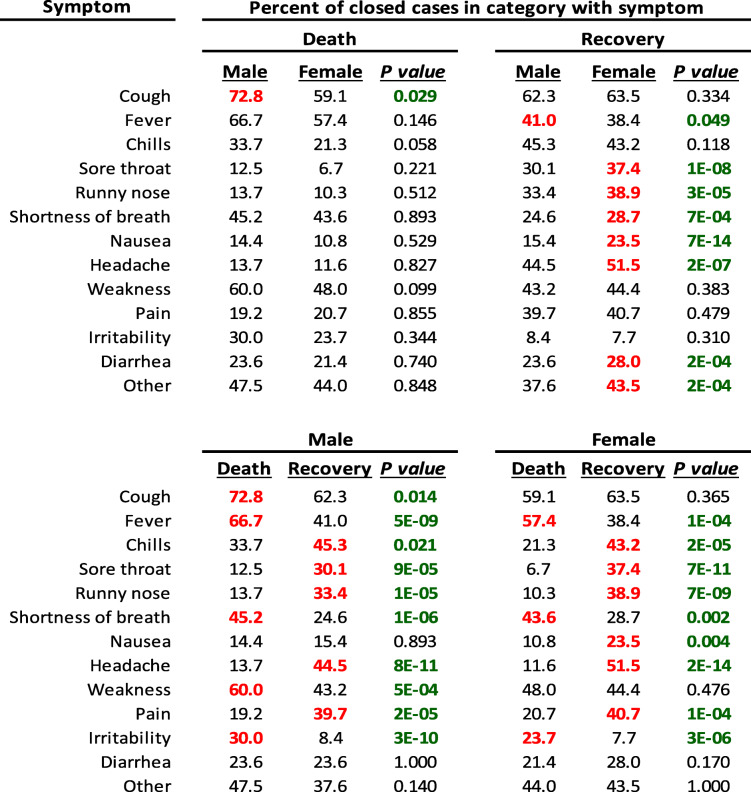
Table 3.
Overall proportions of symptoms in survivors and non-survivors. Data represent the proportion of cases per category that had that symptom. The upper table compares symptom incidence between male and female cases that died or between cases that recovered. For example, males who died reported cough more often than females who died. The lower table compares within males or females, between cases that died or recovered. For example, headache was reported more often in females who recovered than females who died. P values highlighted green were considered statistically significant and values highlighted red were the larger value in the comparison. Data were from the ‘A/Symptomatic, Closed cases’ group and analyzed with Fisher’s Exact Test

