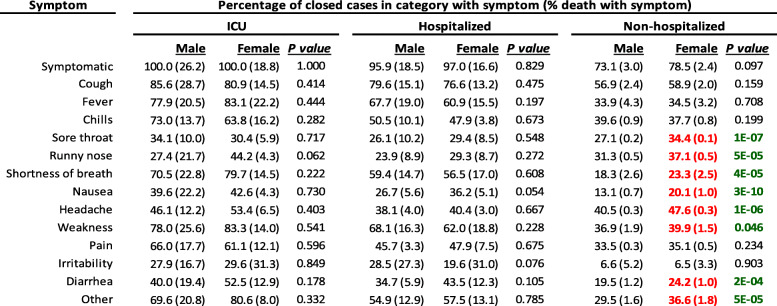
Table 4.
Incidence of symptoms in males and females based on hospitalization status. Data represent the proportion of cases per category that had that symptom. The proportion of cases that die having that sympmtom, in its category, are in parentheses. For example, a higher proportion of non-hospitalized females vs. males reported sore throat. There were no statistical differences in death proportions between males and females when comparing within each hospitialization status, e.g. the proportion of males or females that died in the ICU with cough were not significantly different. P values highlighted green were considered statistically significant and values highlighted red were the larger value in the comparison. Data were from the ‘A/Symptomatic, Closed cases’ group and analyzed with Fisher’s Exact Test

