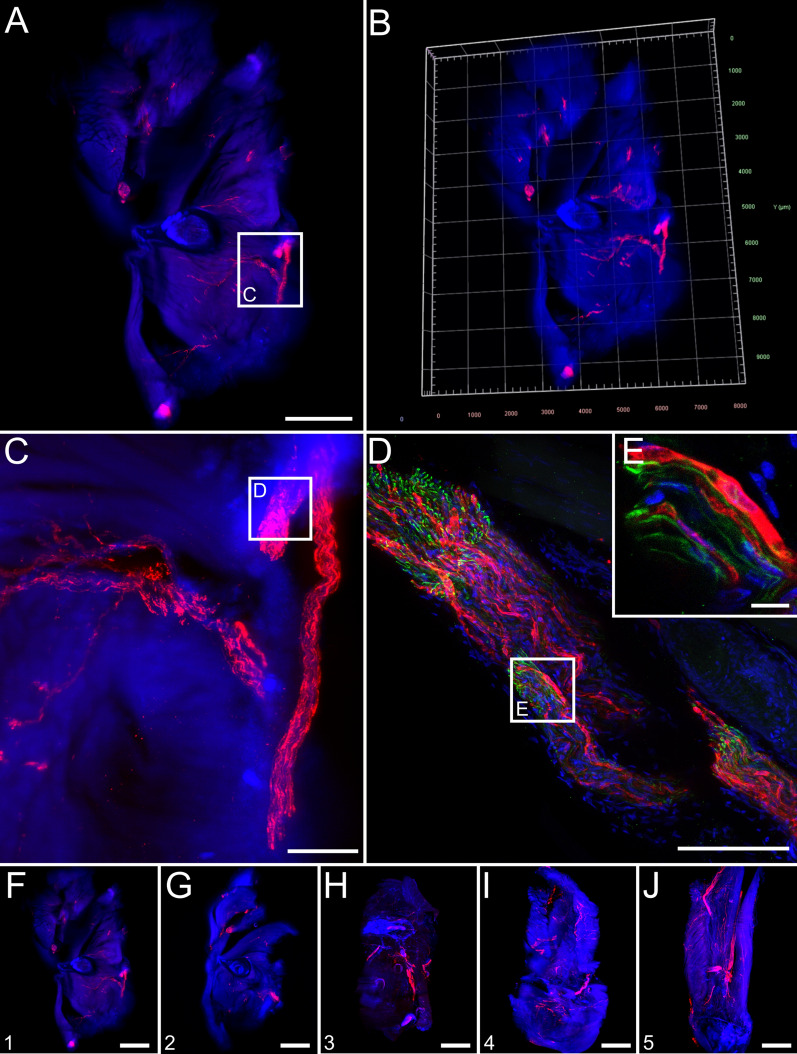
Fig. 1.
Overview of field RABV infection in mouse hind leg cross sections after i.m. infection (9 days post-inoculation). a Maximum z-projection of light sheet overview of a hind leg cross section [1.6× magnification; z = 1156 µm]. Red: RABV P; blue: nuclei. Green fluorescence for NEFM not shown as separation from green autofluorescence was not possible at low resolution. Scale bar: 1500 µm. b 3D projection of (a). c Maximum z-projection of detail (white box in a) with infected nerve [12.6× magnification; z = 574 µm]. Scale bar: 200 µm. d Maximum z-projection of confocal z-stack of indicated region in (C) [z = 48 µm] of infected nerve with NEFM signal (green). Scale bar: 100 µm. Note: due to the separate image acquisition, the orientation of the shown nerve is different to (c). e Maximum z-projection of detail from (d) [z = 10 µm]. Scale bar: 10 µm. f–j Maximum z-projections of serial thick hind leg sections from the upper leg (f) to the knee (j) [1.6× magnification, z = 1156 µm (f), 1402 µm (g), 1172 µm (h), 1990 µm (i), 1372 µm (j)]. For reference, see indicated slices in Additional file 1: Fig. S2A. For improved intelligibility, only RABV P (red) and nuclei (blue) are shown. Scale bar: 1500 µm

