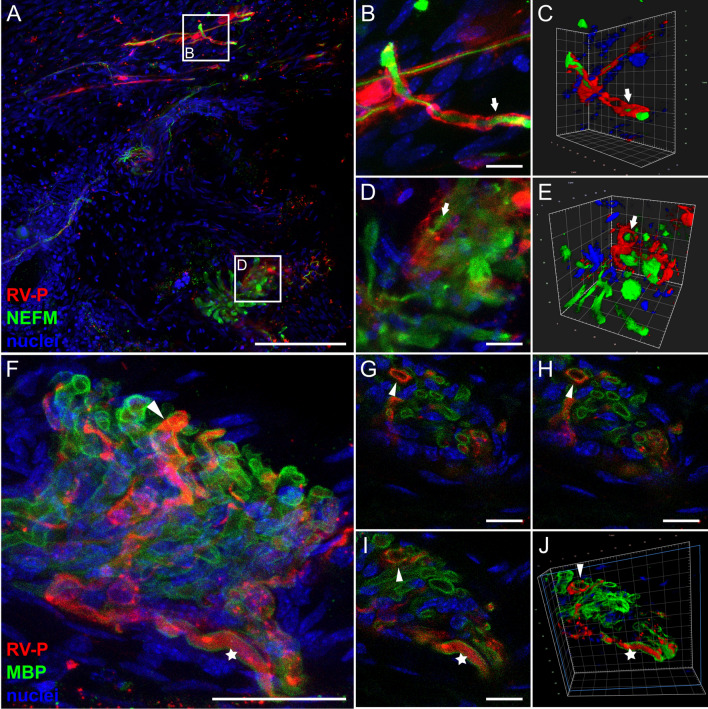
Fig. 7.
RABV P in axons and infected Schwann cells in coronal head sections. a Maximum z-projection of high-resolution confocal z-stacks of mouse head sections after i.c. inoculation and staining for RABV P (red), NEFM (green) and nuclei (blue) [z = 38 µm]. Arrows indicate RABV P surrounding NEFM. Scale bar: 100 µm. b–e Maximum z-projections (b, d) and corresponding 3D projections (c, e) of details of (a) (white boxes). f Maximum z-projection of confocal z-stacks of mouse head sections after i.c. inoculation stained for RABV P (red), MBP (green) and nuclei (blue) [z = 29 µm]. Scale bar: 25 µm. g–i Single slices of (f). Arrowhead: RABV P surrounding MBP-positive myelin sheath. Star: RABV P surrounded by MBP-positive myelin sheath. Scale bar: 5 µm. j 3D projection of (g–h)

