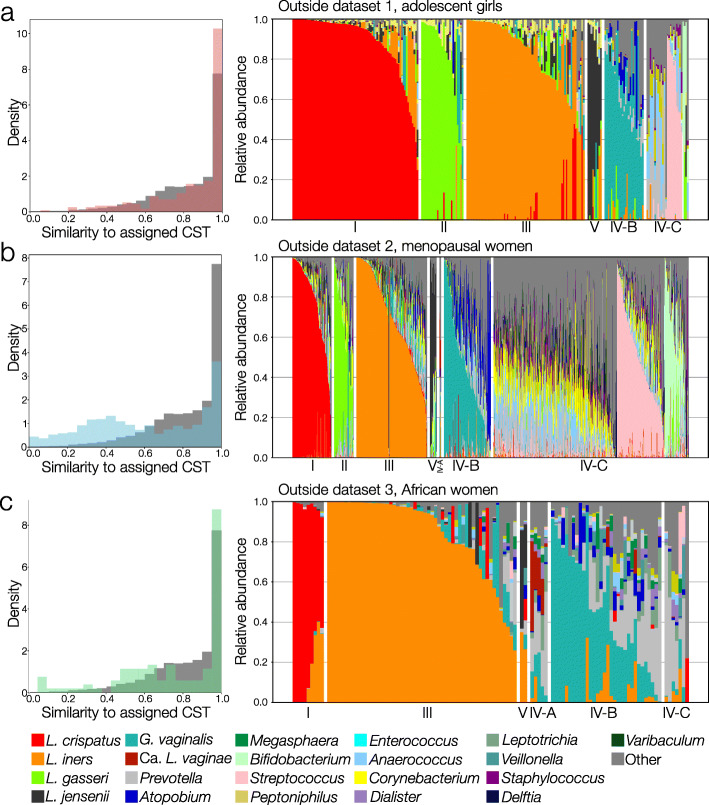
Fig. 4.
Validation of VALENCIA using three test datasets of vaginal taxonomic profiles derived from sequencing of the 16S rRNA gene. For each dataset, the similarity of each sample to its assigned sub-CST is plotted as a normalized histogram (left, a red, b blue, c green) versus that for the training dataset (dark grey). The taxonomic composition of each sample in the dataset is also provided (right). Test dataset 1 (a) was published by Hickey et al., contained 245 samples, was derived from sequencing of the V1V3 region, and contained samples from adolescent girls. Test dataset 2 (b) contained 1380 samples from menopausal women and was derived from sequencing of the V3V4 region. Test dataset 3 (c) was published by McClelland et al., contained 110 samples from eastern and southern African women, and was derived from sequencing of the V4 region

