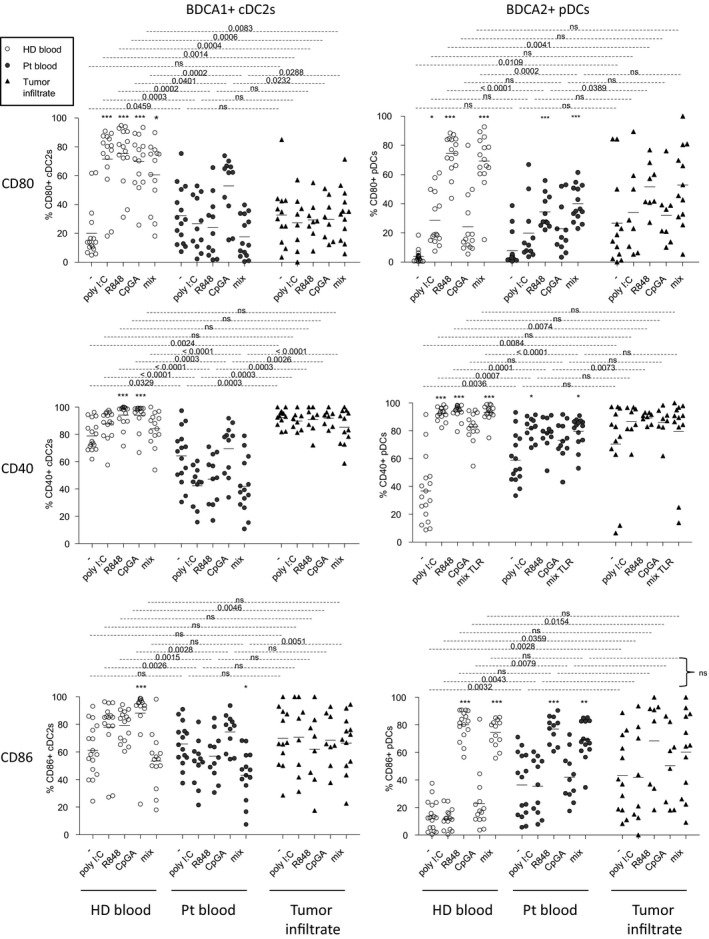
Figure 4.

Circulating and tumor‐infiltrating BDCA1+ cDC2s and BDCA2+ pDCs from melanoma patients displayed defective maturation after TLR stimulation. Cell suspensions from blood (HD, n = 17; Pt, n = 15) or tumor infiltrates (Pt, n = 14) were stimulated or not for 21h with or without TLR ligands (polyI:C, R848 or CpGA) alone or mixed together (mix), and the expression of the co‐stimulatory molecules CD80, CD40 and CD86 was measured on BDCA1+ cDC2s and BDCA2+ pDCs using flow cytometry. Results are expressed as percentages of positive cells within the corresponding subset. Bars indicate mean. Stars indicate significant differences compared to the control condition without stimulation (−) from each group. P‐values were calculated using Mann–Whitney tests (dashed lines) and Kruskal–Wallis with post hoc Dunn’s multiple comparison (stars) nonparametric tests. * P ≤ 0.05, *** P ≤ 0.001.
