Figure 1.

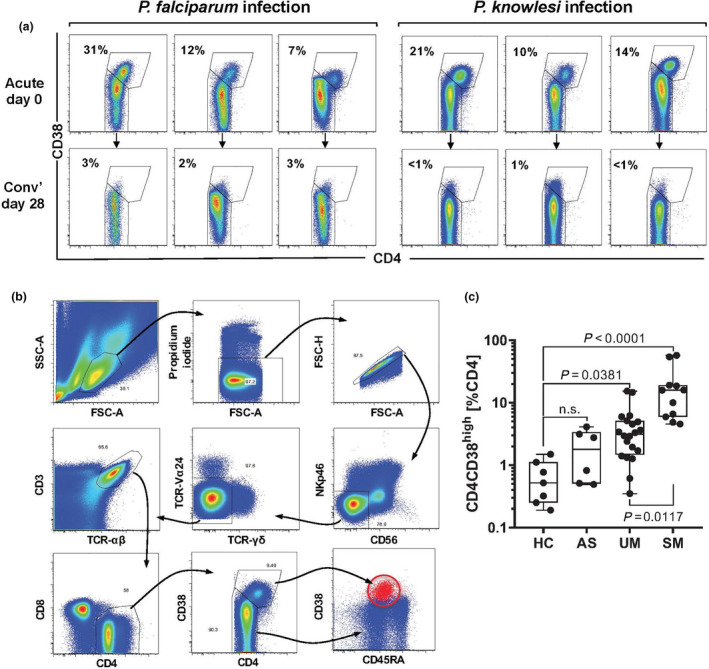
CD4hiCD38hi T cells arise during acute malaria. (a) Flow cytometric assessment of CD4 and CD38 co‐expression on CD4+ T cells in PBMCs of patients with either P. falciparum or P. knowlesi malaria. Top panels show analysis of samples collected on initial presentation to clinic (acute day 0), and lower panels show matched patient samples collected after drug treatment and convalescence (conv’ day 28). The percentage of CD4+ T cells that are CD4hiCD38hi are shown. (b) Representative gating strategy used to identify CD4hiCD38hi T cells. (c) PBMCs collected from Plasmodium‐negative healthy controls (HC; n = 7), Plasmodium‐positive, asymptomatic individuals (AS; n = 6) and patients with acute uncomplicated P. falciparum malaria (UM; n = 20) or severe P. falciparum malaria (SM; n = 11) were analysed by flow cytometry for cell surface marker expression. CD4hiCD38hi cells are shown as the percentage of total CD4+ T cells. Box plots show the minimum, maximum, median and interquartile range for data from all participants. Horizontal lines depict the median with interquartile range. Data were analysed using the Kruskal–Wallis test followed by post‐tests comparing each group with HC.
