Figure 3.

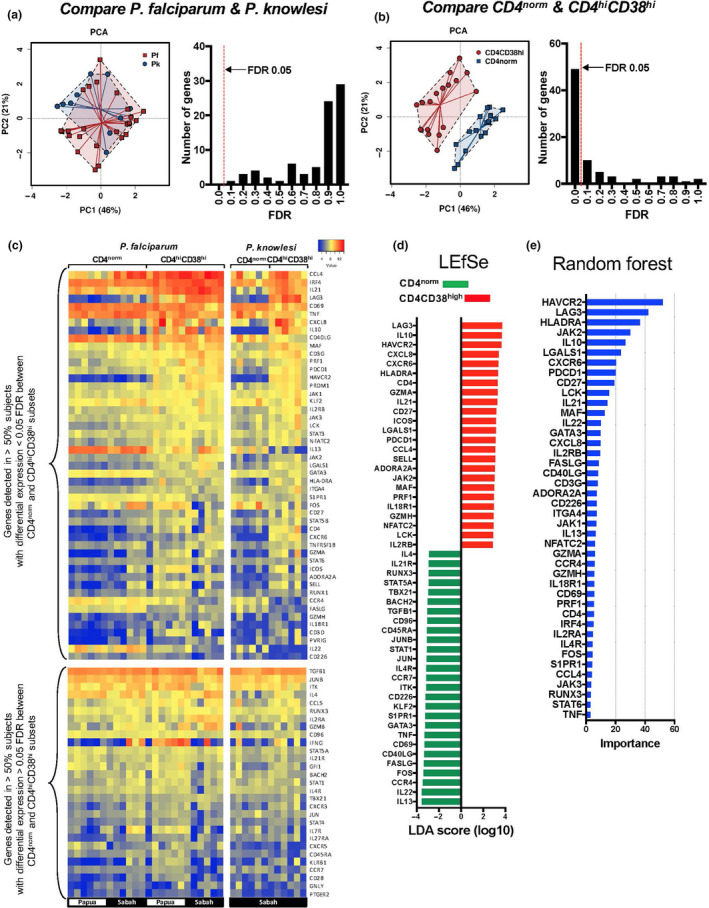
Differential gene expression in CD4hiCD38hi T cells. Differential expression of 130 genes associated with T‐cell function was assessed by NanoString in FACS‐sorted CD4norm and CD4hiCD38hi T cells from patients attending a clinic with acute P. falciparum malaria (Sabah (n = 6) and Papua (n = 6)) or P. knowlesi malaria (Sabah (n = 6)). (a) Differences in fold changes in gene expression from CD4norm to CD4hiCD38hi T cells were analysed by principal component analysis (PCA) comparing cells from patients with P. falciparum and P. knowlesi malaria (left panel), and histogram of false discovery rate (FDR) was assessed by ANOVA (right panel). (b) PCA comparing gene expression in CD4norm and CD4hiCD38hi T cells for combined P. falciparum and P. knowlesi samples and histogram of FDR from a paired t‐test (n = 18). (c) Heatmap of 78 genes reproducibly detected across all samples, showing 49 genes with a FDR < 0.05 in the upper panel (as in 3b above) and the remainder in the lower panel. (d) Linear discriminant effect size analysis (LEfSe) using fold changes in gene expression from CD4norm to CD4hiCD38hi T cells for all 78 detected genes. (e) Random Forest analysis performed on the same data set (truncated at importance value 3).
