Figure 8.
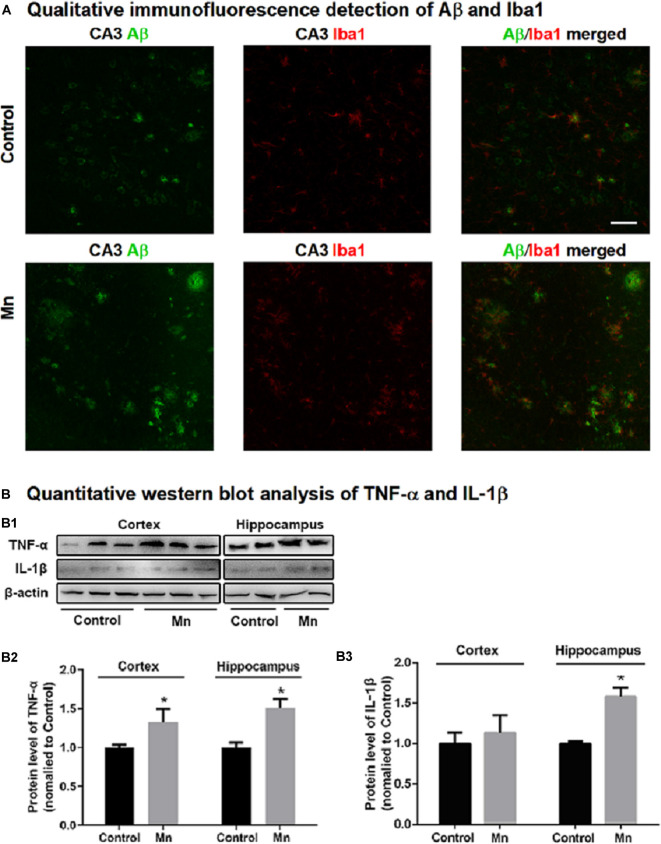
Mn treatment increased microglia inflammatory reaction in 3×Tg-AD mouse brains. (A) Qualitative exemplary confocal microscopic images showing that Aβ (green) was clearly increased, Iba1 signal (red, a marker for microglia) was stronger, and Ibal-labeled microglia were more numerous and in clusters, indicating microglial activation in the hippocampal CA3 area in chronic Mn-treated 3×Tg-AD mice. Scale bar = 40 μm. (B: B1–B3) Western blot quantitative analyses showing the expression levels of TNF-α and IL-1β in the cortex and hippocampus of the 3×Tg-AD mice following chronic Mn treatment. β-actin served as internal control. *p < 0.05, two-way ANOVA, n = 5 for each group.

