Figure 2.
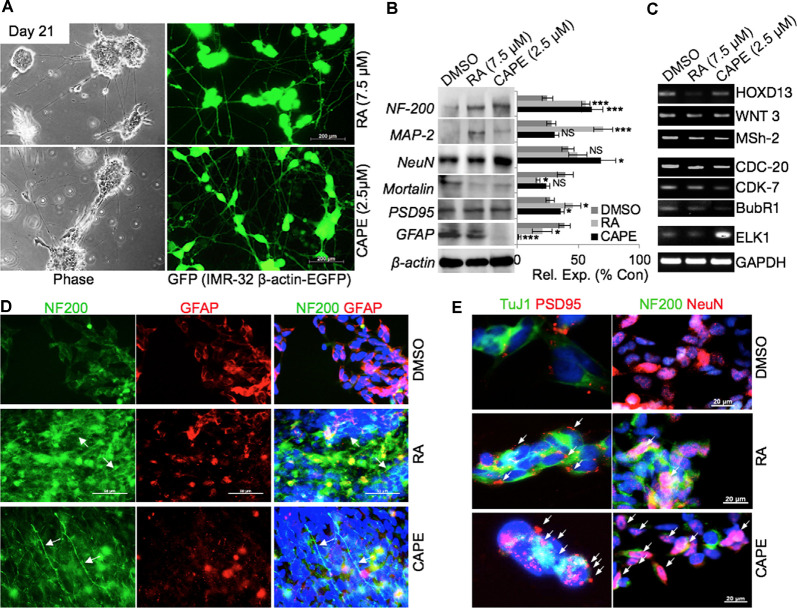
Phenotypic and molecular characterization of CAPE-induced neurodifferentiation. (A) Phase-contrast and fluorescent images of green fluorescent protein (GFP)-tagged IMR32 cells showing differentiated (neuron-like) cell morphology in RA- and CAPE-treated (21 days) cells (scale bar, 200 μm). (B) Immunoblots showing expression levels of NF200, MAP-2, NeuN, Mortalin, PSD95, and GFAP in control, RA-treated, and CAPE-treated cells. β-Actin was used as a loading control. Quantitation of their normalized expression with β-actin is shown on the right. (C) RNA levels as determined by reverse transcriptase (RT)-PCR of the number of genes involved in neuronal proliferation, process, and activities in control, RA-treated, and CAPE-treated cells. (D,E) Immunofluorescence staining showing expression and localization of NF200 and GFAP (D) and TuJ1 and PSD95 (E) differentiated neuronal markers in control, RA-treated, and CAPE-treated cells; scale bar, 50 and 20 μm, respectively. The data were expressed as mean ± SD. The p-values were represented as *p < 0.05, and ***p < 0.001. NS, non-significant.

