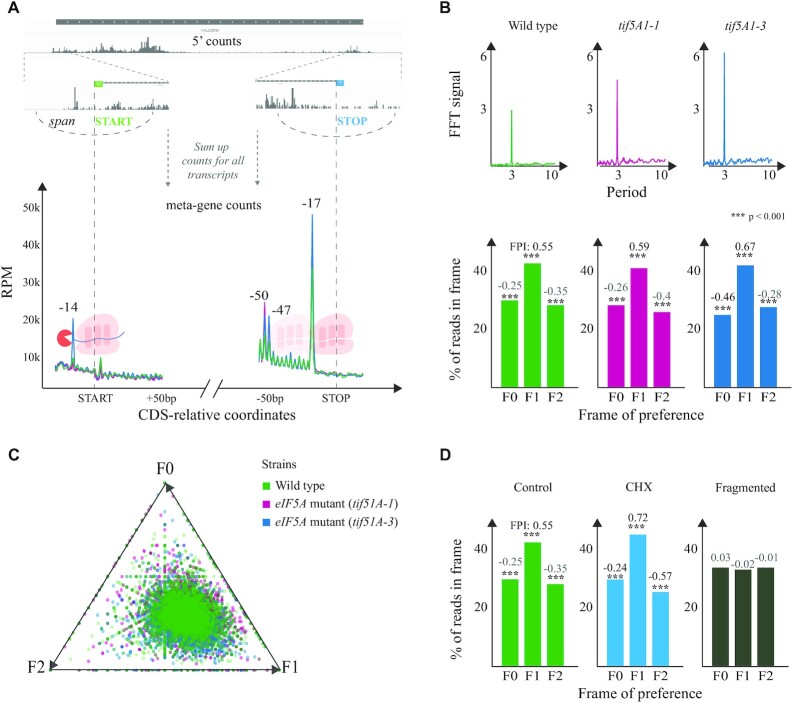
Figure 2.
General 5′P degradome distribution in budding yeast. (A) For each transcript, fivepseq queries a region around the CDS start and stop codons and gets a vector containing 5′P count information. These vectors are summed up to derive a metagene coverage around the start and stop codons. Library size normalized counts are presented as RPM considering only those reads mapping in the coding regions. (B) Top: FFT analysis showing the strength (y-axis) and periodicity (x-axis) values. Bottom: Histograms displaying the global frame preference for the first (F0), the second (F1) and the third (F2) nucleotide of each codon. The FPI shows the strength of preference for each frame along with a t-test p-value comparing the counts to the other two frames. (C) Frame preference values for each gene converted to 2D space in a triangle plot, where each point is a gene and its distance from the triangle vertex is inversely proportional to respective frame preference. (D) Genome-wide frame preferences for a positive control, a CHX-treated sample and a randomly fragmented negative control (3).

