Figure 5.
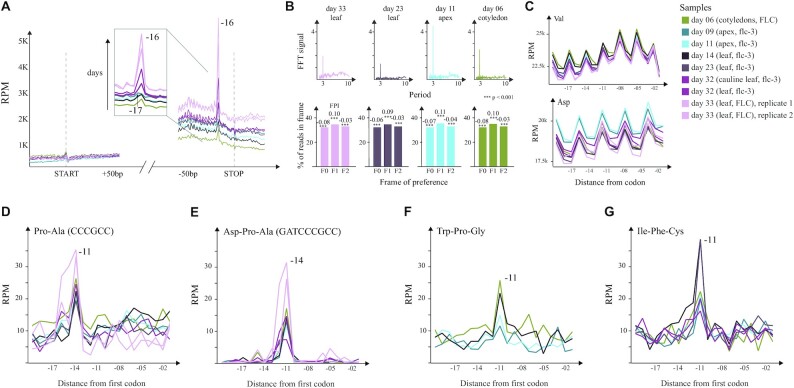
Ribosome protection patterns in A. thaliana. (A) Metagene level protection patterns at start and stop. The stop peak at −17 nt is highlighted to underline the increase in protection associated with growth. (B) Top: FFT analysis showing the strength (y-axis) and periodicity (x-axis) values. Bottom: Histograms displaying the global frame preference for the first (F0), the second (F1) and the third (F2) nucleotide of each codon. The FPI shows the strength of preference for each frame along with a t-test p-value comparing the counts to the other two frames. (C) Top: Uniform protection patterns at valine across the samples. Bottom: Differential usage of aspartic acid in apices compared to leaves. (D) Pro–Ala codon pair leading to increased protection at −14 nt in all the samples. (E) Asp–Pro–Ala tricodon motif leading to increased protection at −11 nt in all the samples. (F) The tripeptide Trp–Pro–Gly leading to increased pausing at −11 nt in younger samples (days 6, 9, 11 and 14). (G) The Ile–Phe–Cys tripeptide causes ribosome pausing at −11 nt in all the samples except for those grown until day 33.

