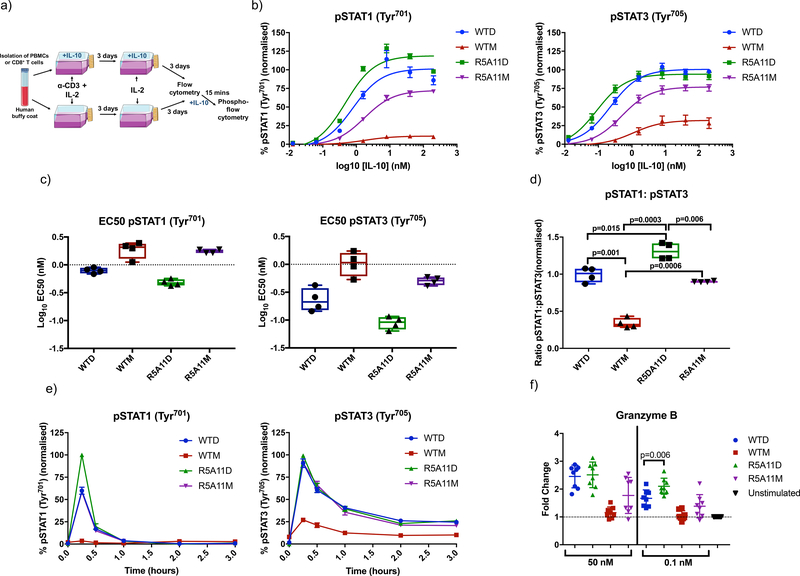
Figure 5. High affinity variants of IL-10 show increased signalling capabilities in human CD8+ T cells.
(a). PBMCs were isolated from human buffy coat samples and/or CD8+ cells were purified by CD8 positive MACS selection. PBMCs and/or purified CD8+ cells were activated for three days using soluble anti-CD3 (100 ng/mL) (PBMCs) or anti-CD3/anti-CD28 beads (CD8+ cells) with IL-2 (20 ng/mL) in the presence or absence of IL-10. On day 3, activation media was removed and the cell populations were placed in media containing IL-2 ± IL-10 for a further 2–3 days before analysis. (b). Dose response curves for pSTAT3 and pSTAT1 in activated CD8+ cells in a PBMC population (activated in the absence of IL-10). Cells were placed in media lacking IL-2 overnight before being stimulated with WT and mutant IL-10 for 15 minutes. Data shown are the mean of four biological replicates with error bars depicting standard error of the mean. Each biological replicate was normalised by assigning the highest MFI value of the top concentration as 100% and the lowest MFI value of an untreated control as 0%. The rest of the samples and conditions were normalized accordingly. (c). Log10 EC50 values for pSTAT3 and pSTAT1 from dose response curves in (b). Each data point represents a biological replicate with a line indicating the mean and error bars showing the minimum and maximum values. Activated CD8+ cells in a PBMC population from 4 donors were analyzed. (d). Ratio of pSTAT1 to pSTAT3 in IL-10-stimulated CD8+ cells in a PBMC population. Ratios were calculated by taking the percentage activation of pSTAT3 and pSTAT1 at 40 nM for four biological replicates and dividing pSTAT1 values by pSTAT3 values. Each data point represents a biological replicate with a line indicating the mean and error bars showing the minimum and maximum values. P value calculated by paired t tests. Activated CD8+ cells in a PBMC population from 4 donors were analyzed. (e). Kinetics of pSTAT3 and pSTAT1 induced by IL-10. Non-activated CD8+ cells in a PBMC population were stimulated with IL-10 for the indicated time periods before fixation. Data shown are the mean of three biological replicates with error bars depicting SEM. Each biological replicate is normalised by assigning the highest MFI value at 15 mins as 100% and the lowest MFI value of an untreated control as 0%. (f). Measurement of granzyme B protein abundance in activated CD8+ T cells (grown and stimulated as in (a)) in the presence of IL-10). Granzyme B protein was quantified by flow cytometry of fixed and permeabilized cells. Fold change was calculated by normalising to a non-IL-10 treated control for each donor. Each data point represents a biological replicate (n=8) and error bars indicate the standard deviation. P value calculated by paired t-test.

