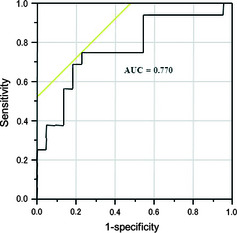
Figure 3.

Receiver operating characteristic curve generated to define the cut‐off value between the higher and lower percentage changes in circulating endothelial progenitor cell numbers before the second cycle of chemotherapy. The cut‐off value is calculated to yield the optimal sensitivity and specificity to distinguish partial response + stable disease from progressive disease. At this threshold, the cut‐off value is 168.6%, the sensitivity is 75.0%, and the specificity is 77.3%. AUC, area under the curve.
