
Figure 1.
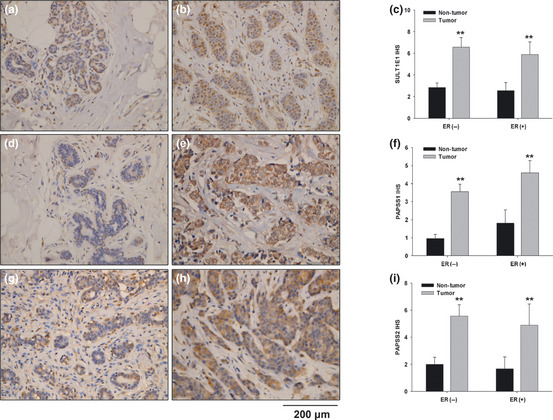
Tissue array analysis of SULT1E1, PAPSS1 and PAPSS2 in 30 cases of breast cancer. Representative staining of SULT1E1 (a,b), PAPSS1 (d,e) and PAPSS2 (g,h) in the adjacent normal breast tissues and tumorous tissues were shown respectively. The immunohistochemical scores of SULT1E1, PAPSS1 and PAPSS2 in the breast tissue assay are summarized as the normalized means of scores ± standard error (SE) in (c,f) and (i), respectively. **P < 0.01 versus adjacent normal breast tissues.