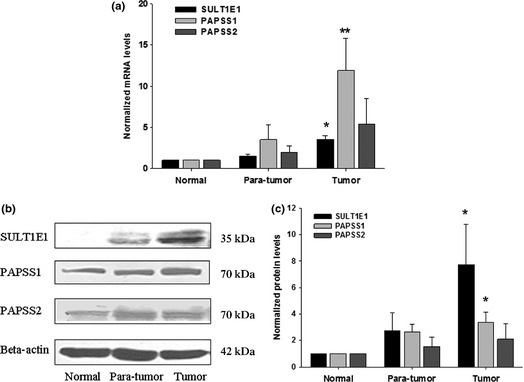
Figure 3.

Expressions of SULT1E1, PAPSS1 and PAPSS2 enzymes in clinical breast tissue samples. The mRNA and protein expressions in normal, para‐tumor and tumor tissues are shown in (a) and (b), respectively. The protein levels were normalized to the internal control and represented as the means of results from different samples ± standard error (SE) (c). **P < 0.01 versus normal tissues.
