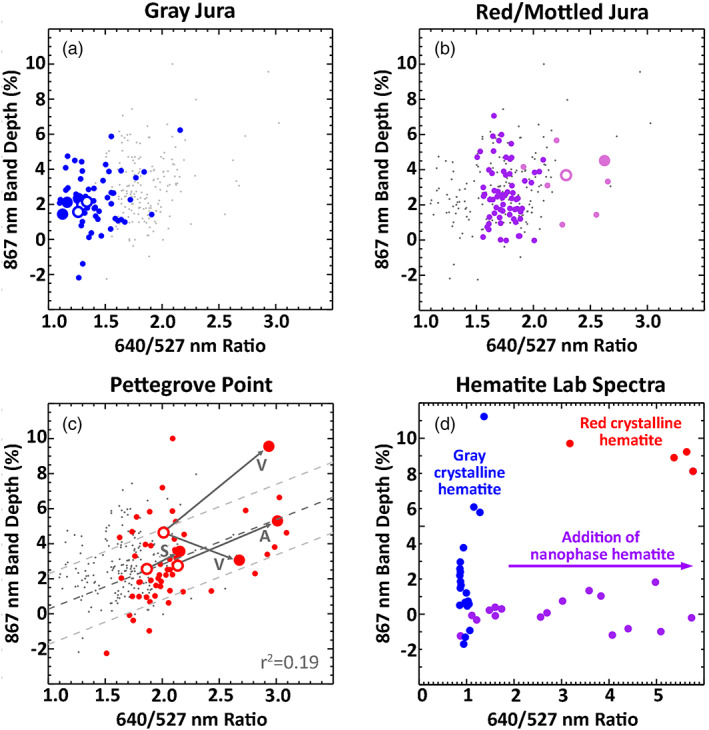
Figure 8.

Comparison of Mastcam ferric spectral parameters for VRR targets, split up by unit. Gray points on all plots indicate all Mastcam bedrock spectra. Large points and circles indicate drill tailings and DRT spots, respectively, as shown in Figures 10, 11, 12, 13, 14. (a) Gray Jura targets, (b) red/mottled Jura targets (pink points indicate Rock Hall), and (c) Pettegrove Point targets (V and S indicate Voyageurs and Stoer). Dashed lines indicate linear fits to colored points shown along with one RMS error envelopes and labeled with R 2 values. (d) The same spectral parameters for hematite laboratory spectra convolved with Mastcam band passes, including gray and red crystalline hematite of various grain sizes (blue for specular/microplaty hematite and red for 0–10 μm red hematite; Clark et al., 2007; Lane et al., 2002) and various concentrations of nanophase hematite suspended in alumina and silica matrices (purple; Morris & Lauer, 1990). See Figure S2 for similar plots for ChemCam passive spectra.
