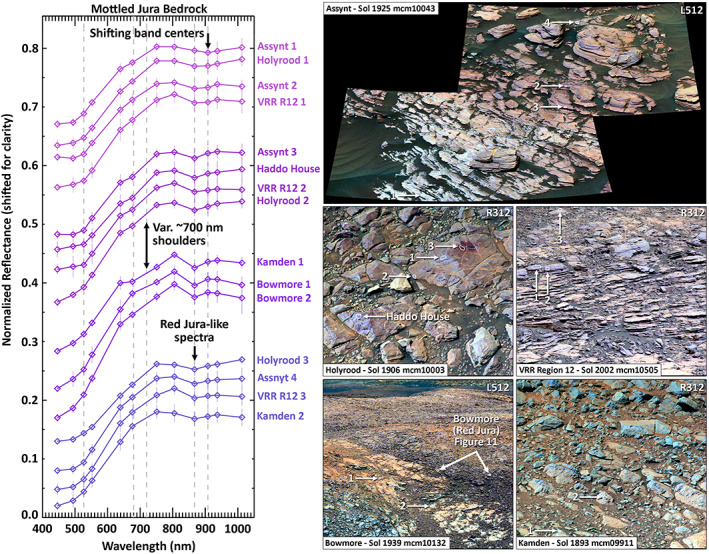
Figure 12.

“Mottled” Jura bedrock at the transition between red and gray Jura bedrock exhibits significant spectral variability at small scales (e.g., within individual blocks), including flattening or shoulders in the ~700 nm region and longer wavelength ~900 nm bands. (left) Mastcam spectra from relatively dust‐free bedrock targets—no multispectral images were acquired of DRT or drill targets in these regions. Spectra are averaged within one contiguous region of interest (ROI), stacked for clarity, and shown with error bars indicating one standard deviation within the ROI. (right) Mastcam enhanced‐color R312 or L512 images of workspace targets corresponding to spectra on left, stretched to enhance local color diversity. White outlines indicate ROIs for each average spectrum.
