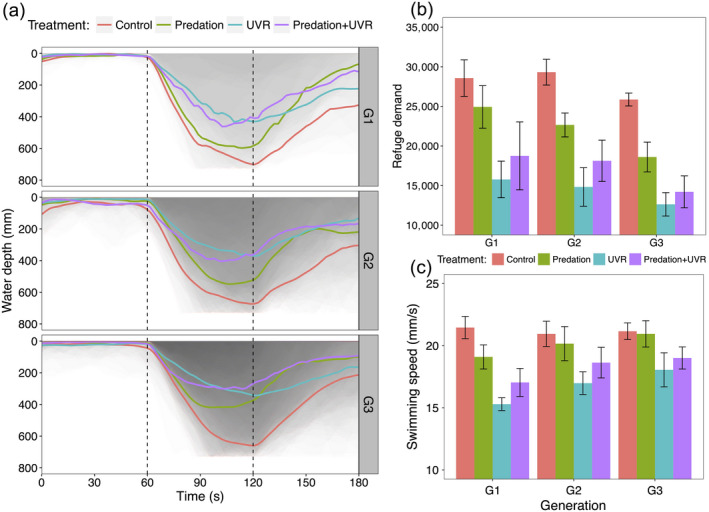
Fig. 2.

Behavioral responses of control, predation, UVR, and the combination of predation and UVR treated Daphnia magna from generation 1 to 3 (G1–G3). (a) Average (thick lines in different colors) and individual (overlapping gray areas) vertical position (mm) during three UVR phases: 1 min (0–60 s) acclimatization, then 60 s with UVR switched on, and then 60 s without UVR. (b) Refuge demand (mm × s) during UVR exposure (the gray areas of the middle 1 min in (a). (c) Mean differences in swimming speed when individuals were exposed to UVR. Individuals which previously had experienced UVR swam slower at the initial generation but the differences decreased at the last generation. Red, green, blue, and purple lines/areas represent control, predation, UVR, and the combination of predation and UVR treatments, respectively. Bars and whiskers show mean ± SE.
