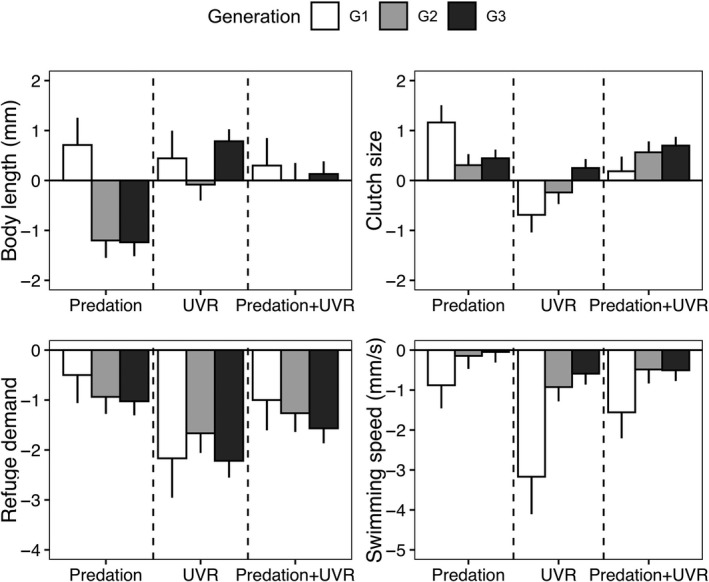
Fig. 4.

The mean effect sizes (Cohen’s d) of (a) body length, (b) clutch size, (c) refuge demand, and (d) speed for Daphnia individuals under treatments of predation, UVR, and the combination of predation and UVR. Bars show the development during three consecutive generations (G1, white bars; G2, light gray bars; G3, dark gray bars), which were normalized using the mean value of control individuals as zero baseline. Error bars are standard errors.
