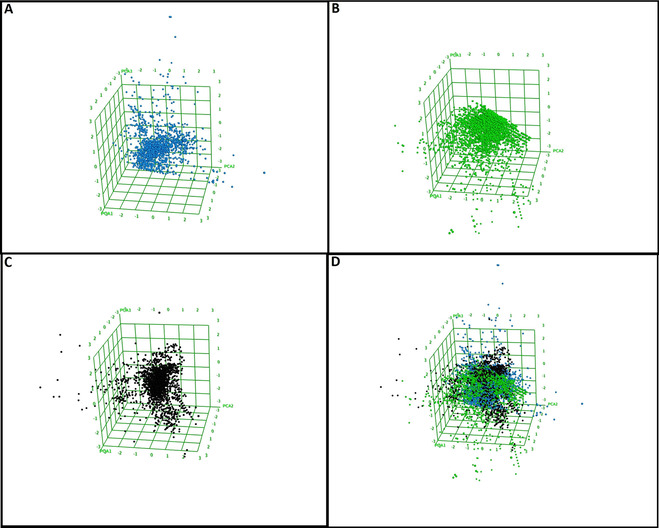
Figure 5.

Chemical space analysis using the best 3 PCAs (PCA1, PCA2 and PCA3). A) Distribution of molecules in EANPDB, B) Distribution of molecules in NANPDB, C) Distribution of molecules in NuBBE and D) Overlay of all three datasets to appreciate their spatial distribution. Blue, Green and black balls represent EANPDB, NANPDB and NuBBE respectively.
