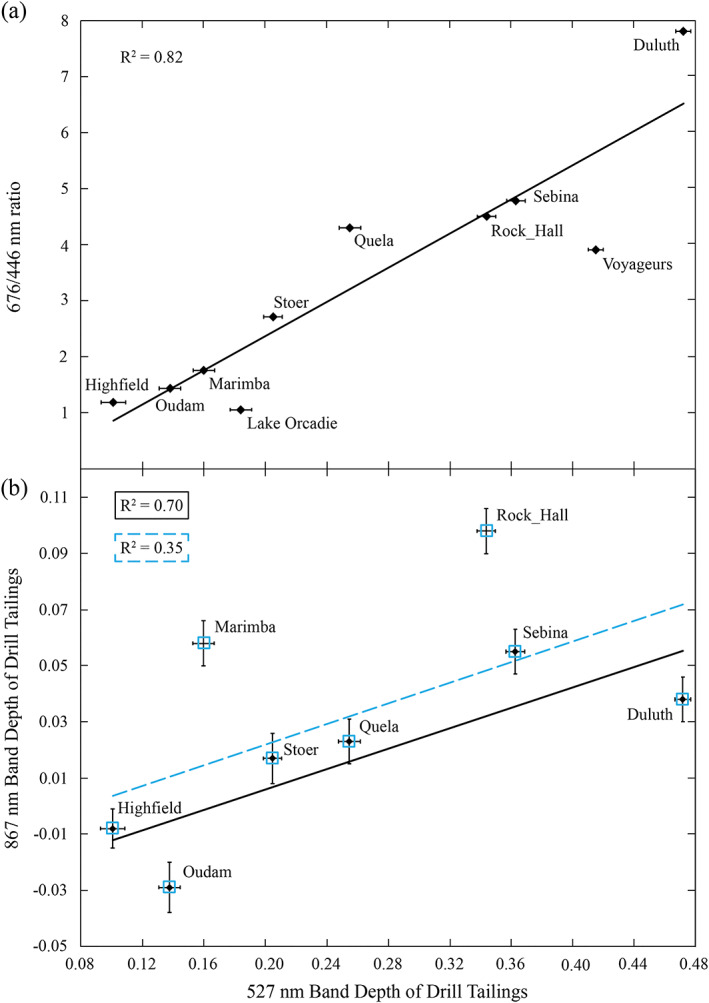
Figure 13.

(a) Comparison of the Mastcam‐derived red/blue ratio to the 527 nm band depth, showing a correlation similar to that seen in ChemCam data (Figure 12). Y axis error bars are smaller than the height of the symbols. (b) Comparison of the Mastcam‐derived 867 and 527 nm band depths of the eight successful drill targets. The dashed blue line shows the best fit correlation with all eight targets (blue square outlines). The solid black line shows the best fit correlation without the possible outlier targets Marimba and Rock Hall.
