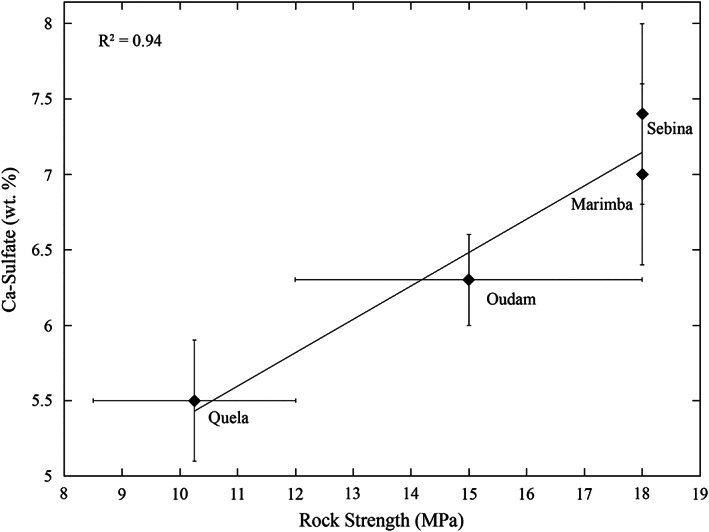
Figure 14.

Comparison between inferred rock strength from drill telemetry (x axis; Peters et al., 2018) and Ca‐sulfate abundance from CheMin analyses (y axis; Rampe et al., 2020) shows a strong positive correlation between the four Upper Murray drill targets. The Duluth and VRR drill targets are not included because they do not have quantitative strengths available. The x‐axis error bars represent the range of possible strengths listed in Peters et al. (2018).
